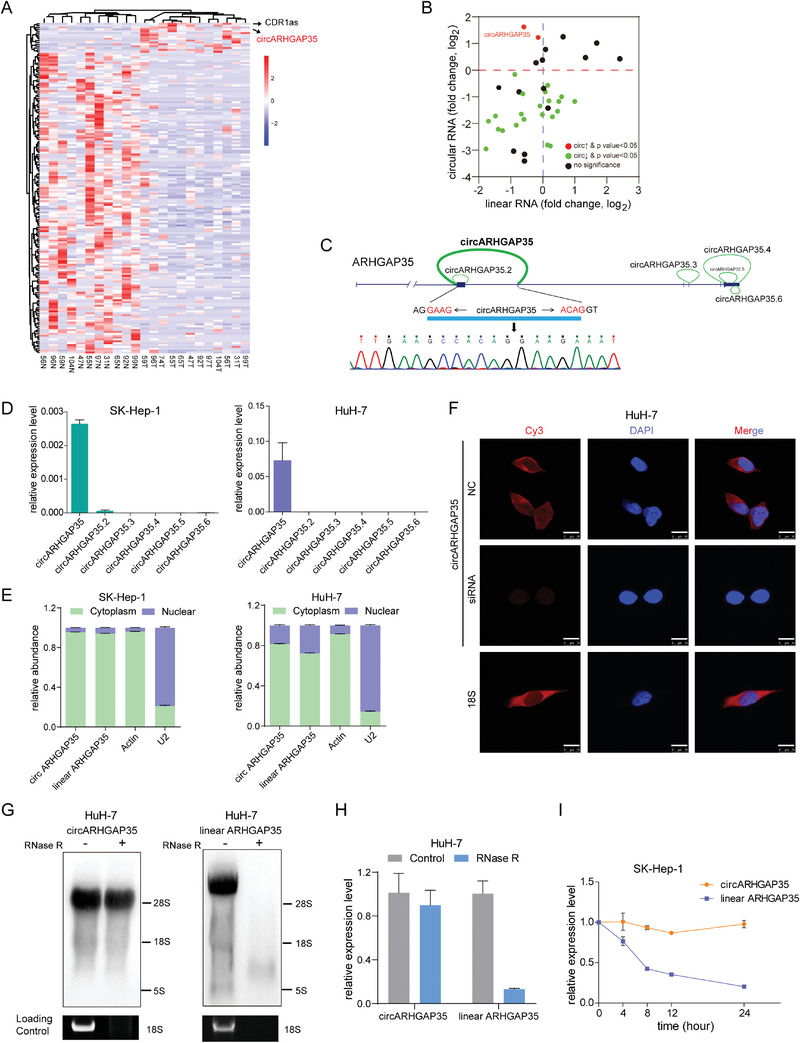
Figure 1.

Identification of a circRNA derived from ARHGAP35 gene. A) Hierarchically clustered heatmap of circRNAs differentially expressed in 12 paired HCC and adjacent non‐cancerous liver tissue samples. Rows represent circRNAs and columns represent tissues. B) The expression of 43 circRNAs and the corresponding linear transcripts from the same gene locus detected by qRT‐PCR in 12 paired HCC and adjacent non‐tumor tissues normalized to β‐actin. Data were presented as the log2 fold change. p values were from paired Student's t‐test (n = 12) and adjusted with Benjamini–Hochberg method. C) The genomic loci of circular ARHGAP35 isoforms. The expression of circARHGAP35 was validated by qRT‐PCR followed by Sanger sequencing. The horizontal arrows refer to the divergent primers used to identify circARHGAP35. The junction site of circARHGAP35 is marked with vertical arrow. D) The expression of six circular ARHGAP35 isoforms in SK‐Hep‐1 and HuH‐7 cells. E) qRT‐PCR analysis of circARHGAP35 and linear ARHGAP35 RNA expression in the cytoplasm or nucleus of SK‐Hep‐1 and HuH‐7 cells. F) Identification of circARHGAP35 by fluorescence in situ hybridization (FISH) with negative control (NC) or the siRNA specifically targeting the back‐splice junction of circARHGAP35 in HuH‐7 cells. Red: circARHGAP35 probes were labeled with Cy3; Blue: nuclei were stained with DAPI. Scale bars, 10 µm. 18S was used as the cytoplasmic control. G) Northern blot for circARHGAP35 and linear ARHGAP35 without or with RNase R treatment using specific probes in HuH‐7 cells. H) qRT‐PCR analysis of circARHGAP35 and linear ARHGAP35 RNA following RNase R treatment in HuH‐7 cells. I) qRT‐PCR analysis of circARHGAP35 and linear ARHGAP35 RNA following actinomycin D treatment at the indicated time points in SK‐Hep‐1 cells. These data were represented as mean ± SEM. Results were performed in at least three independent experiments.
