
Figure 2.
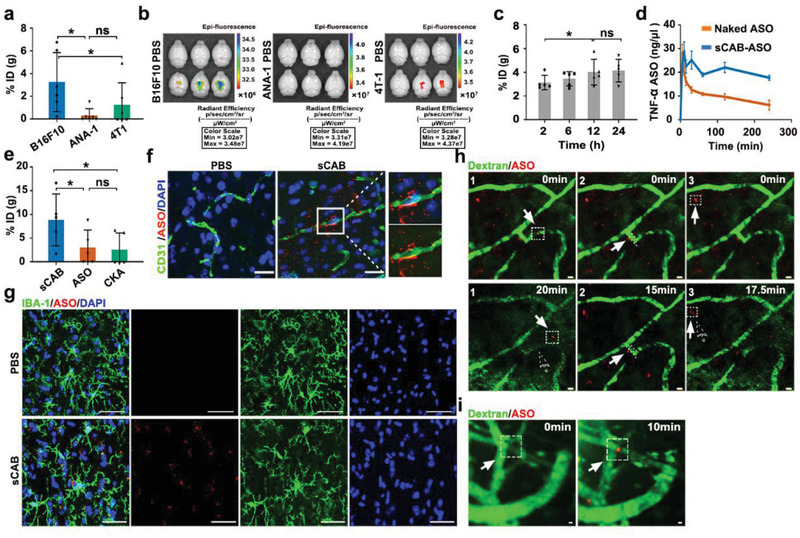
Delivering ASO into the brain by sCABs. a) Brain delivery efficiencies of the 3 types of sCABs (ID: injection dose) 24 h after the injection of 1 × 10⁸ sCABs containing 0.13 µg ASO. The %ID was calculated as the amount of ASO in the whole brain tissues to the total injection dose into mice. b) Examinations of brains harvested from mice that received 1 × 10⁸ sCABs loaded with 0.13 µg Cy5‐ASO by the IVIS Lumina XR small animal imaging system. The brains were isolated 24 h after the injection. The excitation and emission wavelengths were 640 and 670 nm, respectively. c) Time‐series analysis of ASO in the brains of mice that received 2.7 × 10⁹ sCABs with 3.5 µg ASO. d) Hemodynamic analysis of naked and sCABs‐delivered ASO at dose of 3.5 µg. e) Brain delivery efficiency of the ASO of sCABs compared to that of CKA and naked ASO. Mice were injected at the same dose of 3.5 µg ASO into tail vein and brain tissues were excised 24 h later. f) Fluorescence microscopy images of a brain section showing sCABs‐delivered Cy5‐ASO around the brain blood vessels 15 min after injection. The right panels show the magnifications of the areas selected by white square. Scale bar: 25 µm. g) Representative images from fluorescence microscopy showing Cy5‐ASO delivered by sCABs in microglial cells 20 min after injection. Scale bar: 25 µm. h). Intravital real‐time scanning showing the Cy5‐ASO delivered by sCABs in the mouse brain around the microvessels 10 min after injection. The representative tracks of sCABs during their penetration through BBB were respectively labelled and numbered as h‐1, h‐2, h‐3 in this figure, which were consistent with those in the Supporting Information Video 2. The solid arrows and the dotted boxes indicate the positions of ASO (loaded in sCABs) at the indicated times, and the dotted arrow indicates the positions at the beginning of filming (0 min). Scale bar: 5 µm. i) Representative fluorescence microscopy images showing the accumulation of Cy5‐ASO delivered by sCBAs on the abluminal side of the vessels 30 min after the injection. The arrows and dotted boxes highlight the sites where sCABs gathered over time. Scale bar: 5 µm. Images are representative of three independent experiments. Representative results are presented as the means ± SD; n ≥ 5 per group. p‐values are calculated using one‐way ANOVA followed by Bonferroni's multiple comparisons post hoc test (Figure 2a,c,e), * p < 0.05.