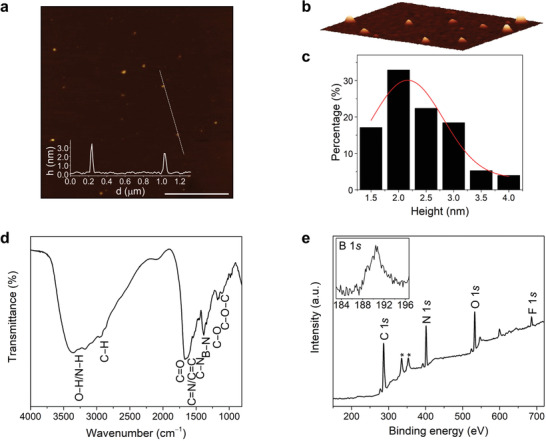
Figure 3.

Morphological and structural characterization of pB‐NCDs. a) Tapping mode AFM (3.0 × 3.0 µm) from a drop‐cast aqueous solution on a mica substrate (scale bar, 1.0 µm), inset is the height profile along the dashed line; b) 3D close‐up AFM image (0.7 × 0.8 µm); c) size histogram with curve fit using a Gaussian model (FWHM: 1.52); d) FT‐IR spectrum; e) XPS survey spectrum showing the C 1s, N 1s, O 1s, B 1s, and F 1s (deconvoluted spectra are in Figure S2, Supporting Information, *from Au substrate).
