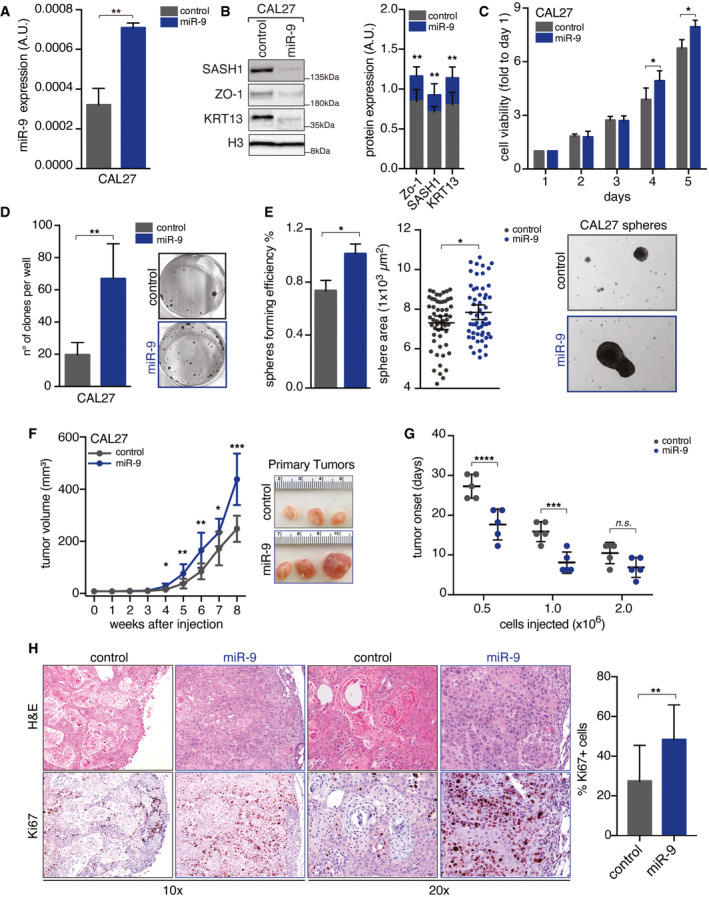
Figure EV1. miR‐9 overexpression increases the tumor‐initiating properties of HNSCC cells.

- qRT–PCR analyses of normalized miR‐9 expression in control and miR‐9 overexpressing CAL27 cells. Data represent the mean (± SD) of three independent experiments performed in duplicate. Unpaired t‐test was used to verify the statistical significance.
- On the left, Western blot (WB) analyses of the indicated protein expression in CAL27 cells described in (A). Histone H3 was used as loading control. Right graph shows the quantification of indicated protein expression normalized on H3 expression. Data represent the mean (± SD) of three biological replicates. Unpaired t‐test was used to verify the statistical significance.
- Cell viability analyses of cells described in (A, B) over a period of 5 days using MTS cell viability assay. Data represent the mean (± SD) of three independent experiments performed in sextuplicate. Unpaired t‐test was used to verify the statistical significance per each time point.
- Colony formation assay of the cells described in (A, B). Left graph reports the number of clones per well. Right, representative images of clones are shown. Data represent the mean (± SD) of three independent experiments performed in duplicate. Unpaired t‐test was used to verify the statistical significance.
- Sphere‐forming assay of cells described in (A, B). Left graph reports the sphere‐forming efficiency. Middle graph reports the area of first‐generation spheres. Each dot represents one analyzed sphere. On the right, typical images of 10× field are shown. Data represent the median (± SD) of three independent experiments performed in duplicate. Unpaired t‐test was used to verify the statistical significance.
- Left graph reports the tumor volume (mean ± SD) in NSG mice injected with control and miR‐9 overexpressing CAL27 cells followed for up to 35 days (n = 5 mice/group). On the right, typical images of explanted tumors formed by control and miR‐9 CAL27 cells at necropsy. Unpaired t‐test was used to verify the statistical significance at each time point.
- Graph reporting the tumor onset (mean ± SD) in NSG mice injected with different numbers of control (shCTR) and miR‐9 overexpressing CAL27 cells, as described, and followed for up to 35 days (n = 5 mice/group). Each dot represents a tumor. Two‐way ANOVA with Sidak’s multiple comparison test was used to calculate statistical significance.
- Typical images of hematoxylin & eosin (H&E—upper left panel) and Ki67 expression (Ki67—bottom left panel) evaluated by immunohistochemistry (IHC) in tumors explanted from mice described in (G). Right graph reports the percentage of Ki67‐positive cells (mean ± SD). Each dot represents a tumor, and unpaired t‐test was used to verify the statistical significance.
Data information: In the figure, A.U. = arbitrary units; *P < 0.05; **P < 0.01; ***P < 0.001.
Source data are available online for this figure.
