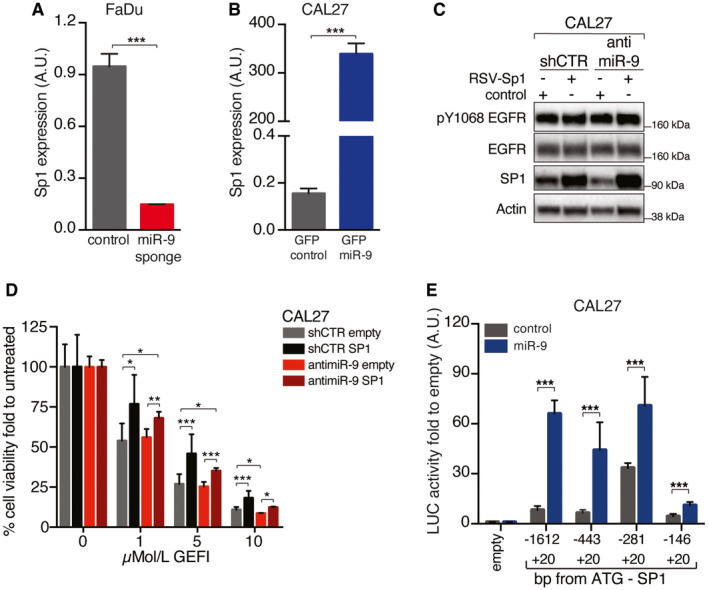
Figure EV2. miR‐9 positively regulates Sp1 expression.

- qRT–PCR analyses of Sp1 expression in control (shCTR) and anti‐miR‐9 (miR‐9 sponge) FaDu cells. Data represent the mean (± SD) of three independent experiments performed in duplicate, and unpaired t‐test was used to verify the statistical significance.
- qRT–PCR analyses of Sp1 expression in CAL27 cells transiently transduced with and PGK‐miR‐9 (GFP‐miR‐9) or control (GFP control) vector as indicated. Data represent the mean (± SD) of three independent experiments performed in duplicate, and unpaired t‐test was used to verify the statistical significance.
- WB analyses of the indicated protein expression in control (shCTR) and miR‐9 CAL27 cells, overexpressing or not RSV‐Sp1 as indicated. Actin was used as loading control.
- Graphs reporting the cell viability of CAL27 cells described in (C) and treated with increasing concentration of gefitinib (GEFI) and evaluated using the MTS assay. Data represent the mean (± SD) of two independent experiments performed in sextuplicate, and two‐way ANOVA with Sidak’s multiple comparison test was used to verify the statistical significance.
- Graph reporting the normalized luciferase activity of Sp1 promoter fragments in CAL27 cells control or stably overexpressing miR‐9. Data are the mean (± SD) of three independent experiments performed in duplicate, and two‐way ANOVA with Sidak’s multiple comparison test was used to verify the statistical significance.
Data information: In the figure, A.U. = arbitrary units; *P < 0.05; **P < 0.01; ***P < 0.001.
Source data are available online for this figure.
