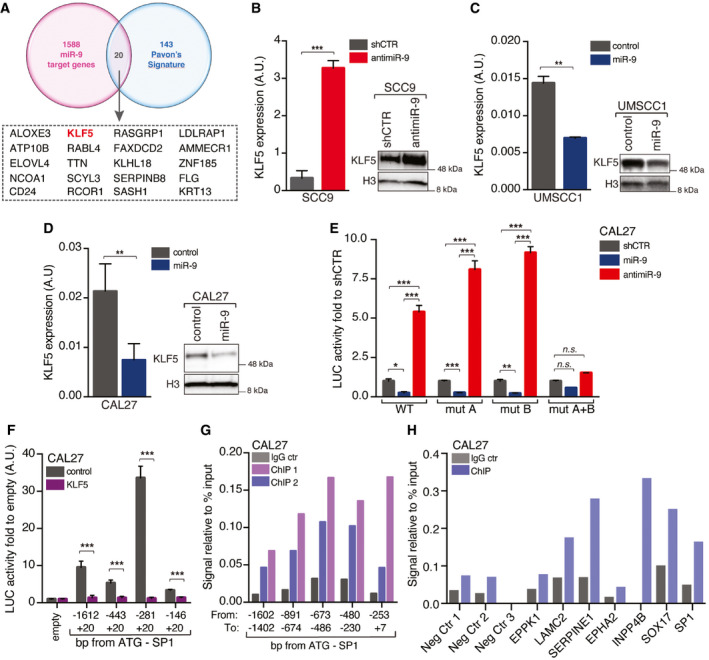
Figure EV3. miR‐9 positively regulates Sp1 transcription by targeting KLF5.

-
AVenn Diagram showing the number of miR‐9 potential targets among the genes altered during HNSCC progression as described in Pavón et al (2012).
-
B–DqRT–PCR WB analyses reporting KLF5 mRNA (left graph) and protein (right WB) expression in control (shCTR) or anti‐miR‐9 SCC9 cells (B), in control or miR‐9 overexpressing UMSCC1 cells (C), or in control or miR‐9 overexpressing CAL27 cells (D). Data represent the mean (± SD) of three independent experiments performed in duplicate, and unpaired t‐test was used to verify the statistical significance. In WB analysis, histone H3 was used as loading control.
-
EGraph reporting the normalized luciferase activity of wild type (WT) or mutated KLF5 3’‐UTR described in Fig 4C in control (shCTR), miR‐9 overexpressing, or anti‐miR‐9 CAL27 cells, as indicated. Data represent the mean (± SD) of three independent experiments performed in duplicate, and two‐way ANOVA with Sidak’s multiple comparison test was used to verify the statistical significance.
-
FGraph reporting the normalized luciferase activity of Sp1 promoter fragments in CAL27 cells transfected with control or KLF5 vectors, as indicated. Data represent the mean (± SD) of three independent experiments performed in duplicate, and unpaired t‐test was used to calculate the statistical significance.
-
GChromatin immunoprecipitation (ChIP) assay performed on CAL27 cells. The graph reports the binding of KLF5 to the indicated region of Sp1 promoter expressed as signal relative to input in two independent immunoprecipitations (ChIP1 and ChIP2) using the KLF5 ab. IgG was used as negative control on the same chromatin.
-
HChromatin immunoprecipitation (ChIP) assay performed on CAL27 cells. The graph reports the binding of KLF5 to the indicated genomic regions used as negative (Neg Ctr 1, Neg Ctr 2, and Neg Ctr 3) or potentially positive controls (EPPK1; LAM2C2; SERPINE1; EPHA2; INPP4B; SOX17) of anti‐KLF5 antibody specificity. The Sp1 ‐673/‐486 fragment was amplified on the same DNA recovered from the IP as internal reference.
Data information: In the figure, A.U. = arbitrary units; *P < 0.05; **P < 0.01; ***P < 0.001.
Source data are available online for this figure.
