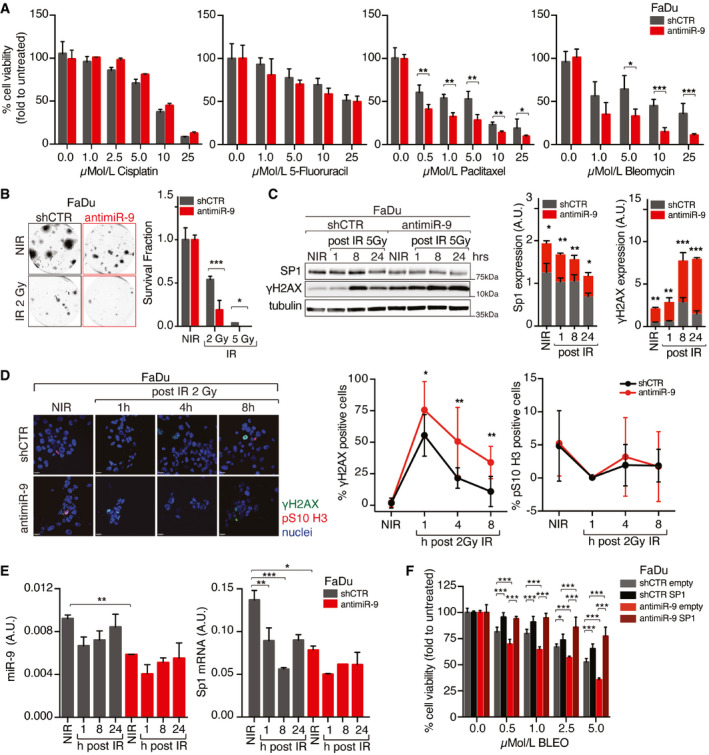
Figure 5. miR‐9 protects HNSCC cells from RT‐induced cell death.

- Graph reporting cell viability of control (shCTR) and anti‐miR‐9 FaDu cells treated with increasing concentration of the indicated drugs for 72 h and analyzed using the MTS cell viability assay. Data represent the mean (± SD) of three independent experiments each performed in sextuplicate, and unpaired t‐test was used to calculate the statistical significance per each dose.
- Clonogenic assay of control (shCTR) and anti‐miR‐9 FaDu cells not irradiated (NIR) or treated with 2 or 5 Gy IR. On the left, typical images of cell clones are shown. On the right, the graph reports the percentage (± SD) of survived cells respect to not irradiate cells in three independent experiments performed in triplicate. Unpaired t‐test was used to calculate the statistical significance per each dose.
- Left, WB analyses of the indicated protein expression in control (shCTR) and anti‐miR‐9 FaDu cells not irradiated (NIR) or treated with 5 Gy IR and allowed to repair for the indicated hours (h). Tubulin was used as loading control. On the right, protein quantification analyses of KLF5 and Sp1 expression normalized on tubulin loading control. On the right, graphs report the quantification of the indicated proteins normalized on tubulin expression. Data are expressed as mean (± SD) of three independent experiments, and unpaired t‐test was used to calculate the statistical significance at time point.
- Left panel reports typical immunofluorescence images of control (shCTR) or anti‐miR‐9 FaDu cells, not irradiated (NIR) and analyzed 1, 4, or 8 h after 2 Gy IR (γH2AX green, pS10‐H3 red, nuclei in blue). Graphs report the percentage of γH2AX (middle)‐ and pS10‐H3 (right)‐positive cells. Data represent the mean (± SD) of three independent experiments in which at least 10 randomly selected fields were evaluated. Unpaired t‐test was used to calculate the statistical significance at each time point.
- Graphs report the qRT–PCR analyses evaluating the expression of miR‐9 (left) or SP1 (right) in cells treated as in (C). Data are the mean (± SD) of three independent experiment performed in duplicate. Two‐way ANOVA with Sidak’s multiple comparison test was used to calculate the statistical significance.
- Graph reporting cell viability of control (shCTR) and anti‐miR‐9 FaDu cells, overexpressing or not SP1, and treated with increasing concentration of Bleomycin (BLEO) for 72 h and analyzed using the MTS cell viability assay. Data represent the mean (± SD) of three independent experiments each performed in sextuplicate. Two‐way ANOVA with Sidak’s multiple comparison test was used to verify the statistical significance.
Data information: In the figure, A.U. = arbitrary units; *P < 0.05; **P < 0.01; ***P < 0.001.
Source data are available online for this figure.
