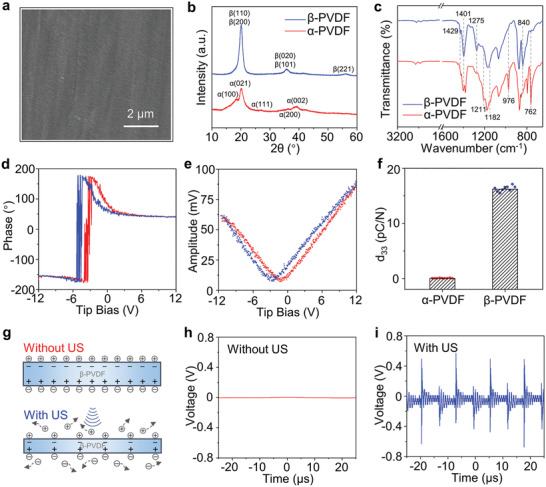
Figure 1.

Material characterization. a) SEM image of β‐PVDF. b) XRD patterns of α‐PVDF and β‐PVDF. c) FT‐IR spectra of α‐PVDF and β‐PVDF. d) Phase curve and e) amplitude curve of β‐PVDF at ramp voltages from −12 to 12 V. f) The d33 constant of α‐PVDF and β‐PVDF. g) Illustration of the ultrasound‐triggered piezoelectric effect. The output voltage of β‐PVDF h) without or i) with US. US, ultrasound stimulation.
