Figure 2.

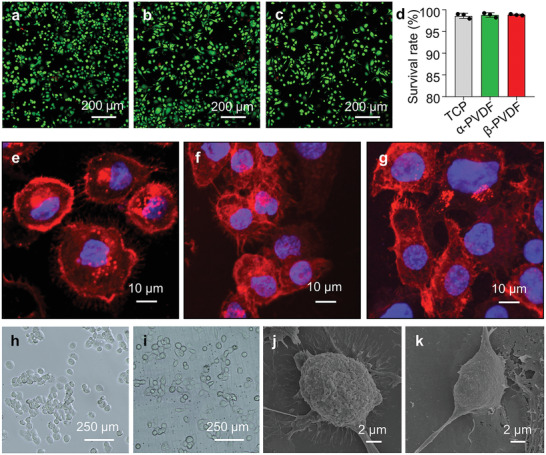
Cytocompatibility of β‐PVDF. Merged images of live (green) and dead (red) PMA‐pretreated THP‐1 cells seeded on a) TCP, b) α‐PVDF, and c) β‐PVDF for 24 h. d) The survival rate of PMA‐pretreated THP‐1 cells on TCP, α‐PVDF, and β‐PVDF (mean ± SD, n = 3). Images of F‐actin (red) and nuclear (blue) staining of cells on e) TCP, f) α‐PVDF, and g) β‐PVDF for 24 h. Bright field images of PMA‐pretreated THP‐1 cells on h) TCP and i) β‐PVDF for 24 h. Representative spreading morphology of THP‐1 cells on j) TCP and k) β‐PVDF for 24 h. The experiments were performed three times independently.
