Figure 3.

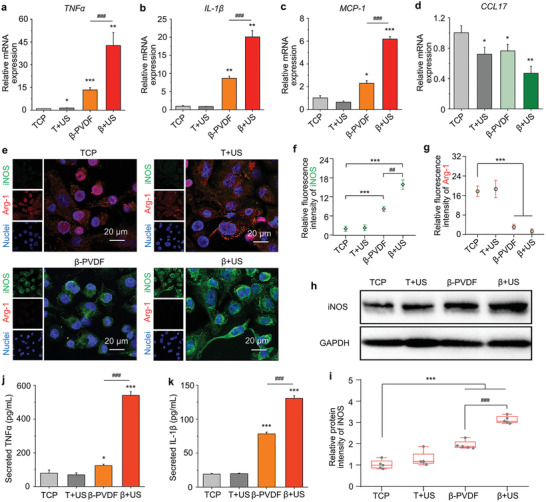
The piezoelectric effect enhances the M1 polarization of macrophages with ultrasound irradiation. Relative mRNA expression of the M1 markers a) TNF‐α, b) IL‐1β, and c) MCP‐1 and d) the M2 marker CCL17 in macrophages cultured on TCP, T+US, β‐PVDF, and β+US for 3 d (T, TCP; β, β‐PVDF; US, ultrasound stimulation). The data are presented as the mean ± SD and were normalized to the level in the TCP group. e) Immunofluorescence staining images of iNOS (an M1 marker) and Arg‐1 (an M2 marker) after 3 d of culture. Statistical analysis of f) iNOS and g) Arg‐1 fluorescence intensity by ImageJ software. h) Western blot analysis of iNOS protein expression in cells on TCP, T+US, β‐PVDF, and β+US. i) Statistical analysis of iNOS protein intensity in (h) by ImageJ software. j) Secreted TNF‐α level and k) secreted IL‐1β level on day 3, as measured by ELISA. Significance was determined by unpaired two‐tailed Student's t‐test (* p < 0.05, ** p < 0.01, *** p < 0.001 vs the TCP control group, ### p < 0.001 vs the β‐PVDF group (n = 3 exception for (i) (n = 5)). The experiments were performed three times independently.
