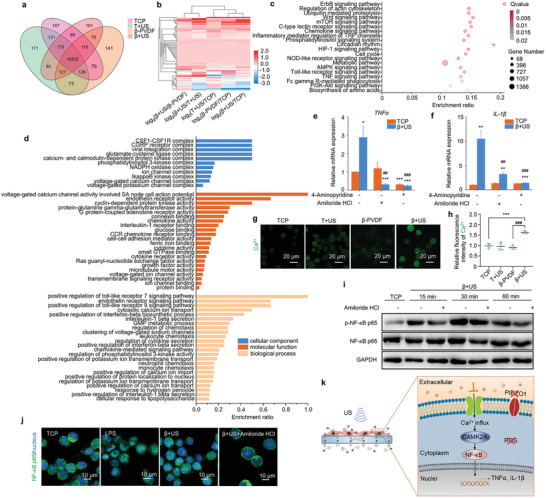
Figure 4.

Polarization mechanism of the piezoelectric effect. a) Venn diagram of differentially expressed genes between the TCP, T+US, β‐PVDF, and β+US groups. b) Heat map of differentially clustered voltage‐gated ion channels. c) KEGG pathway enrichment analysis of differentially expressed genes between the TCP and β+US groups. The 20 most significantly enriched pathways are shown. d) GO classification of differentially expressed genes between the TCP and β+US groups related to the cellular component, molecular function, and biological process categories (p < 0.05 for cellular component, p < 0.01 for molecular function and biological process). e) TNF‐α and f) IL‐1β mRNA expression in macrophages in the TCP and β+US group following treatment with 4‐aminopyridine and amiloride HCl. Significance was determined by unpaired two‐tailed Student's t‐test (** p < 0.01, *** p < 0.001 vs the β+US group (n = 3)). g) Detection of Ca2+ influx in macrophages in the TCP, T+US, β‐PVDF and β+US groups. h) Statistical analysis of Ca2+ fluorescence intensity by ImageJ software. Significance was determined by unpaired two‐tailed Student's t‐test (*** p < 0.001 vs the TCP control group, ### p < 0.001 vs the β‐PVDF group (n = 5)). i) Western blot analysis of NF‐κB p65 protein expression in the TCP and β+US groups. j) Immunofluorescence staining for NF‐κB p65 in the TCP, β+US and β+US+amiloride HCl groups. k) Schematic illustration of the polarization mechanism of the piezoelectric effect. The experiments were performed three times independently.
