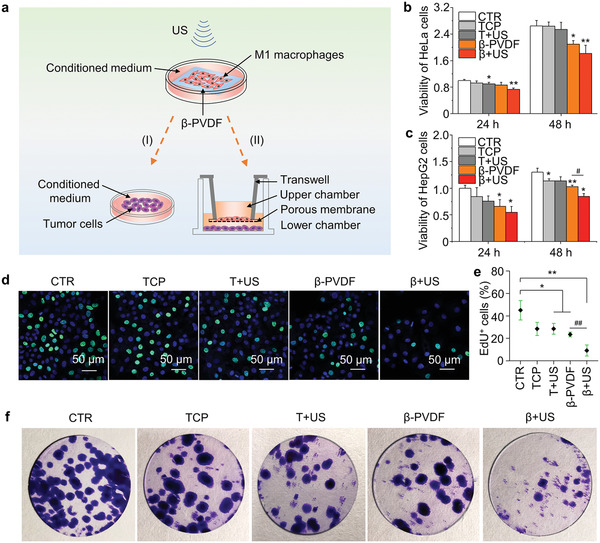
Figure 5.

Coculture of macrophages and tumor cells. a) Illustration of the cocultures. Viability of b) HeLa cells and c) HepG2 cells cultured with medium conditioned by macrophages in the TCP, T+US, β‐PVDF, and β+US groups after 3 d of culture normalized to the viability of the untreated control group (CTR). d) Analysis of the proliferation of HepG2 cells in the CTR monoculture group and those cocultured with macrophages in the TCP, T+US, β‐PVDF, and β+US for 3 d by the EdU assay. EdU is indicated by green fluorescence, while nuclei are blue. e) Statistical analysis of EdU+ HepG2 cells by ImageJ software. f) Colony formation by HepG2 cells cultured in 24‐well tissue culture plates in the CTR monocultured group and those cocultured with macrophages in the TCP, T+US, β‐PVDF, and β+US groups for 10 d. Significance was determined by unpaired two‐tailed Student's t‐test (* p < 0.05, ** p < 0.01 vs the CTR control group, # p < 0.05, ## p < 0.01 vs the β‐PVDF group (n = 3)). The experiments were performed three times independently.
