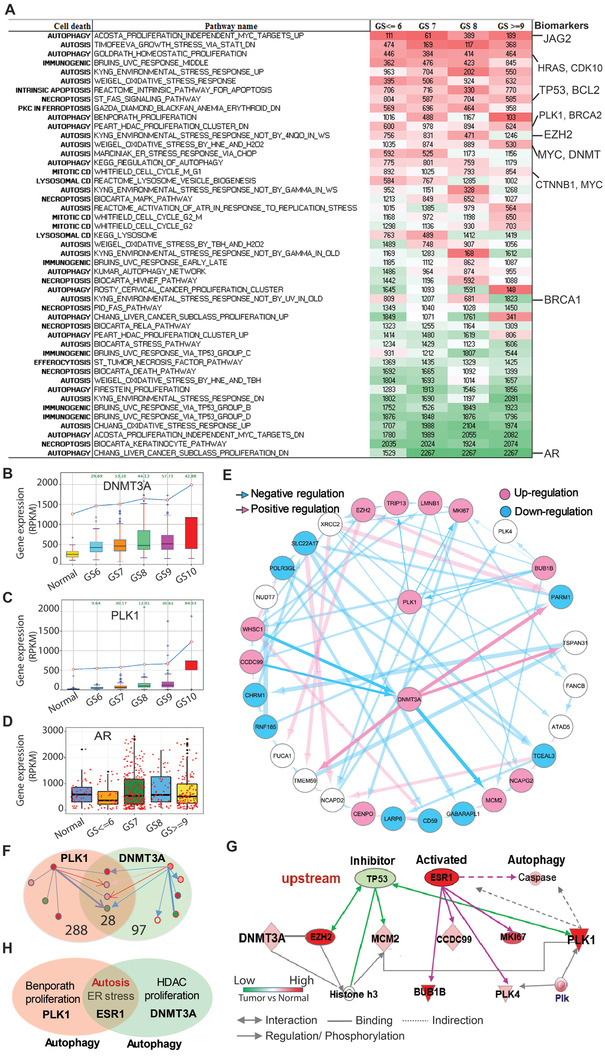
Figure 2.

Enrichment analysis of cell death‐related pathways during PCa progression. A) Dynamic variation of pathways in 497 patients with various GSs. The numbers indicate the rank of indicated pathways changed during PCa progression. Green and red color indicates decreased and increased rank of corresponding pathway respectively. B) Increase in the level of DNMT3a during PCa progression. C) Increase in the level of Plk1 during PCa progression. D) AR expression variation during PCa progression. E) Bayesian network inference analysis to identify gene expression profiles in 497 PCa patients. Directed arcs represent causal dependencies and derive belief values by multiplying conditional probabilities. The thin line indicates low‐probability and thick line indicates high‐probability. The red color means the positive regulation and blue color is the negative regulation (inhibition). F) Crosstalk mechanism through the optimal path between Plk1 and DNMT3a identified by STRING PPI network analysis. The encoded nodal dependencies in BN enable it to predict accurately even when important values are unavailable in advanced patients (GS 8–10). The number of genes regulated by Plk1 and DNMT3a or regulating Plk1 and DNMT3a is 385, among which 288 and 97 genes are associated with Plk1 and DNMT3a respectively. There are 28 genes overlapping the regulation of PLK1 and DNMT3a. G) Plk1 and DNMT3a co‐expressing genes in 497 PCa patients were integrated with a causal gene regulation biology network. Causal analysis with Ingenuity Pathway Analysis (IPA, http://www.ingenuity.com) is used to infer and score regulator networks based on a large‐scale causal network. This casual network derives from the Ingenuity Integration Prior Knowledge Base, including 12 heterology networks. The analysis is to search for key genes or molecules contributing to the variation of Plk1 and DNMT3a in the gene regulation network in the advanced PCa patients from TCGA. Pearson correlation analysis is used to identify the co‐expression genes associated with Plk1 and DNMT3a with gene expression profiles of patients from TCGA. These co‐expression genesets are input into IPA to identify upstream regulators. In advantage of prior knowledge, the causal analysis approach can illuminate the biological activities that occurred in the crosstalk associated with the progression of PCa. H) Identification of estrogen receptor α and autophagy as a common signaling node shared by elevation of Plk1 and DNMT3a.
