
Figure 1. Distinct genomic profiles of cells from individuals of Back versus White ancestries are accompanied by signs of genomic admixture and variation.
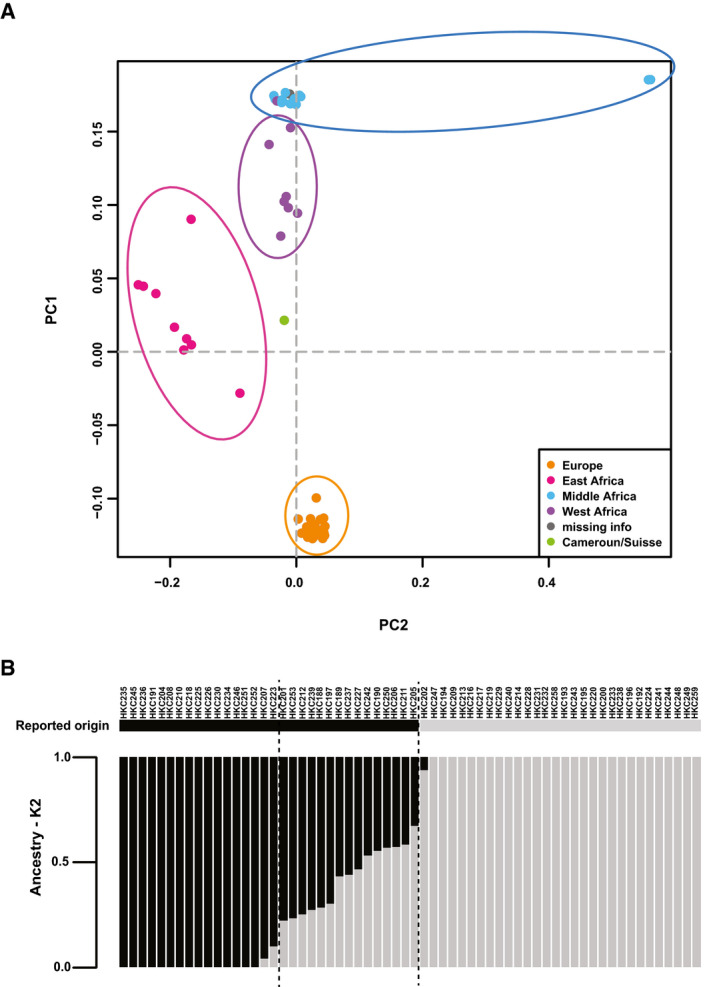
- Principal component analysis (PCA) based on 53,837 single nucleotide polymorphism (SNPs) markers of 62 foreskin donors assessed by microarray chip hybridization (via Illumina Human Omni2.5). PLINK (Package: PLINK1.07) and GCTA analysis tools were used for genetic distance analysis. The first two components (PC1 and PC2) are plotted and explain 5.1% of the variance. Dotted line corresponds to eigenvectors at 0. Each point represents a foreskin donor. Points are labeled and grouped according to self‐reported donors’ country of origin.
- Admixture analysis of the indicated HKC strains of Black versus White individuals, on the basis of the SNP genotype dataset with the simplest assumption of two ancestries (K = 2). On the y‐axis admixture proportions are represented as gray and black bars. On the x‐axis, individual samples are reported. Dashed lines delimit Black individuals with more than 20% admixture of the other ancestry.