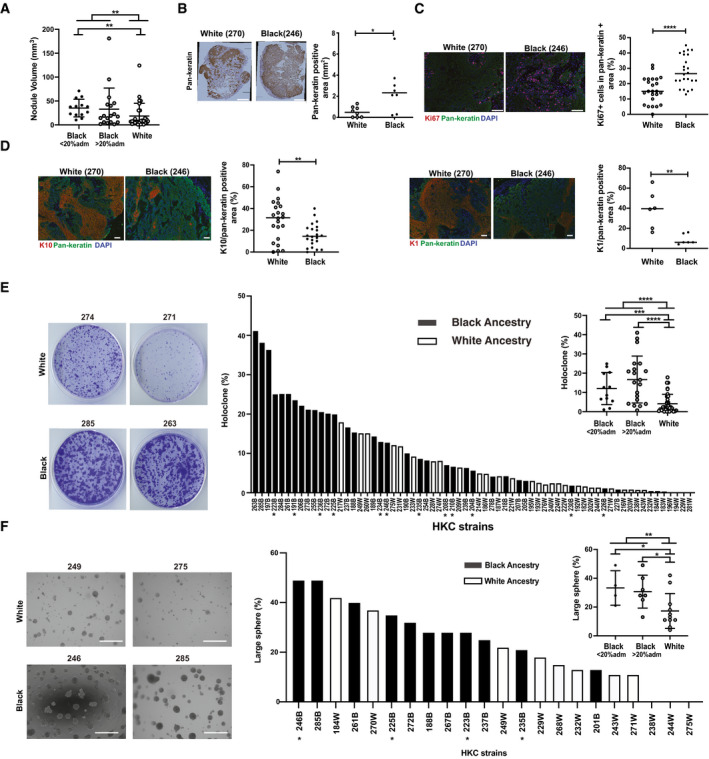
Figure 2. HKCs from individuals of Back versus White descent display greater oncogenic and self‐renewal potential.

-
AMultiple HKC strains (passage 2,3) from individuals of the two ancestries were stably infected with a lentivirus expressing dominant‐negative mutant TP53 (TP53R248W) and superinfected with a H‐RasV12 expressing virus, followed, 24 h later, by parallel intradermal injections into the back of NOD‐SCID female mice. 7 strains per ancestry, 4–5 mice per assay were used. Tumors were excised 15 days post‐injection. Shown is size quantification of all individual tumors (dots) by digital caliper. **P < 0.01. n(tumors by White HKCs) = 28, n(tumors by Black HKCs) = 31, n(tumors by Black HKCs with < 20% genome admixture) = 13. Two‐tailed unpaired Mann–Whitney test. In the plot, bars represent mean ± SD.
-
BRepresentative immunohistochemical analysis with anti‐pan‐keratin antibodies of a pair of tumor lesions formed by parallel injections of White versus Black HKC strains together with quantification of the pan‐keratin positive areas (mm2) of individual lesions (dots) formed by 6 HKCs strains of the two ancestries. n(tumors per ancestry) = 8. *P < 0.05. Horizontal line: median. Two‐tailed unpaired t‐test. Scale bar: 500 µm.
-
C, DDouble immunofluorescence analysis of tumors formed by 6 HKC strains, as in the previous panels, with antibodies against Ki67 (C) and keratin 10 and 1 (K10, K1) (D) together with anti‐pan‐keratin antibody for tumor cell identification. Shown are representative images and quantification of results of individual lesions (dots). Digitally acquired images were used to determine the % of Ki67‐positive cells (C) and of K1/K10 positivity (D) in pan‐keratin‐positive areas, examining 3‐5 fields in each case. For Ki67, K10, and K1 staining: n(tumors per ancestry) = 24, 22, and 6, respectively. ****P < 0.0001; **P < 0.005, horizontal line: median, two‐tailed unpaired t‐test. Scale bars: 100 µm.
-
EColony‐forming assay of multiple HKCs from White versus Black donors (passages 2,3) plated in triplicate dishes, at limited density (1,000 cells per 60‐mm dish). At day 8, cells were fixed and stained by crystal violet, and percentage of large colonies (“holoclones”), 10x size relative to total number of colonies in the dish, was determined by Fiji software. Shown are representative images and bar graph quantification in decreasing order of holoclone‐forming capability by all indicated HKC strains (three dishes per strain). Asterisks indicate Black strains with < 20% admixture (Fig 1B). Inset: pooled values of all HKCs from White versus Black ancestries shown as individual dots together with mean ± SD. n(White HKC strains) = 35; n(Black HKCs, total, < and > 20% genome admixture strains) = 32, 12, and 20, respectively. ***P < 0.0005; ****P < 0.0001, two‐tailed unpaired t‐test.
-
FSphere‐forming assays of HKC strains from White and Black donors plated in Matrigel suspension (2,000 cells per 8‐well chamber slide, 2–3 wells per strain) and cultured for 8 days. Quantification of large spheres (> 2,000 pixels ≥ 0.0095 mm2) versus total number of spheres (> 100 pixels ≥ 0.00047 mm2) formed by each strain was determined by Fiji software. Shown are representative images together with bar graph quantification in decreasing order of large sphere‐forming capability by all indicated HKC strains. Asterisks indicate Black strains with < 20% admixture (Fig 1B) Inset: pooled values of all HKCs from White versus Black ancestries shown as individual dots together with mean ± SD. n(White HKC strains) = 11; n(Black HKCs, total, < and > 20% genome admixture strains) = 11, 4, and 7. **P < 0.01; *P < 0.05. Two‐tailed unpaired t‐test. Scale bars: 300 µm.
