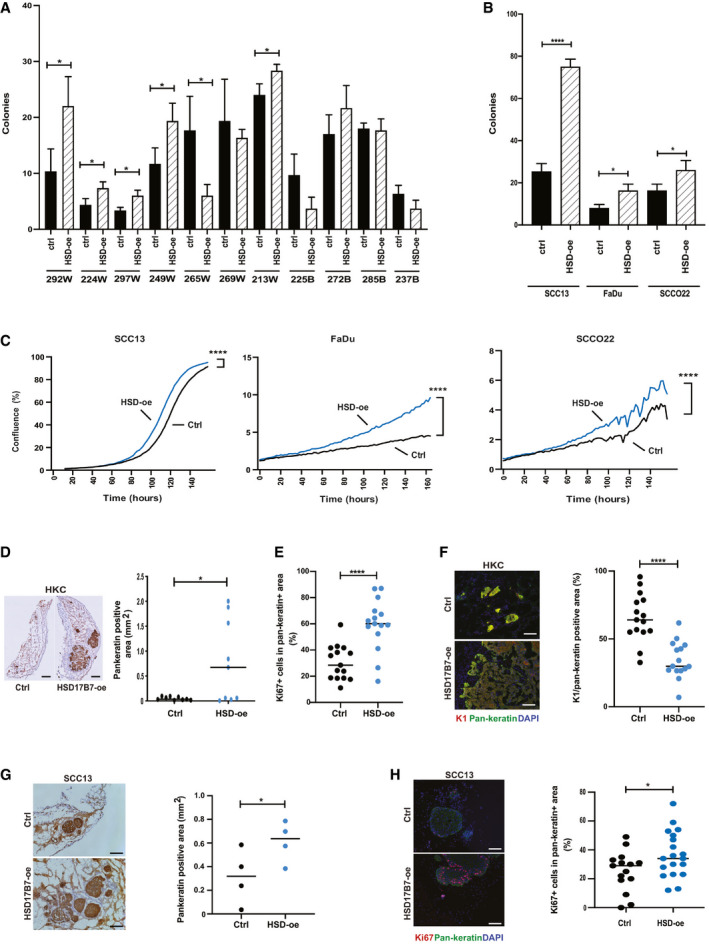
Figure 5. HSD17B7 is a positive determinant of HKC and SCC cell proliferative and oncogenic potential.

-
AColony‐forming assays of multiple HKC strains from White and Black donors (passages 2,3) infected with an HSD17B7‐expressing lentivirus (HSD‐oe) versus empty vector control (ctrl), plated in triplicate dishes at limited density (1,000 cells per 60‐mm dish) at 5 days after infection. A week later cells were fixed and stained by crystal violet, and number of colonies (> 0.149 mm2) was determined. Shown are numbers of colonies ± SD. n(dishes per condition) = 3. *P < 0.05. 2‐tailed unpaired t‐test.
-
BColony‐forming assays of the indicated SCC cell lines stably infected with an HSD17B7‐expressing lentivirus (HSD‐oe) versus empty vector control (ctrl), utilizing the same conditions as in the previous panel. Shown are numbers of colonies ± SD. n(dishes per condition) = 3. *P < 0.05; ****P < 0.0001. Two‐tailed unpaired t‐test.
-
CProliferation live‐cell imaging assays of SCC cell lines plus/minus HSD17B7 overexpression as in the previous panel. Cells were plated in triplicate wells in 96‐well plates followed by cell density measurements (IncuCyte), taking four images per well every 2 h for 150–160 h. n (wells per condition) = 3. ****P < 0.0001. Pearson r correlation.
-
D–FIntradermal tumorigenicity assays with HKCs (269W) stably infected with an HSD17B7 overexpressing lentivirus (HSD17B7‐oe) versus control (Ctrl). Experimental conditions were the same as in Fig 2. Mice were sacrificed 15 days after injection. Shown are representative images and quantification of tumor cell density assessed by immunohistochemical staining with anti‐pan‐keratin antibodies (D), as well as % of Ki67‐positive cells (E) and K1 positivity (F) of pan‐keratin positive areas. For (D), n(tumors per condition) = 9; for (E and F) n(3 fields per tumor, 5 tumors per condition) = 15. *P < 0.05, ****P < 0.0001. Horizontal line: median. 2‐tail unpaired t‐test. Scale bar: 500 µm (D), 100 µm (F).
-
G, HIntradermal tumorigenicity assays with SCC13 cells overexpressing HSD17B7 (HSD17B7‐oe) versus control (Ctrl). Mice were sacrificed 15 days after injection. Shown are representative images and quantification of tumor cells density, assessed by immunohistochemical staining with anti‐pan‐keratin antibodies (G) as well as % of Ki67‐positive cells in pan‐keratin‐positive areas (H). For (G), n(tumors per condition) = 4; for (H), n(3–5 fields per tumor, 4 tumors per condition) 15, 19. *P < 0.05; horizontal line: median. One‐tailed paired t‐test. Scale bar in (G, H): 100 µm.
