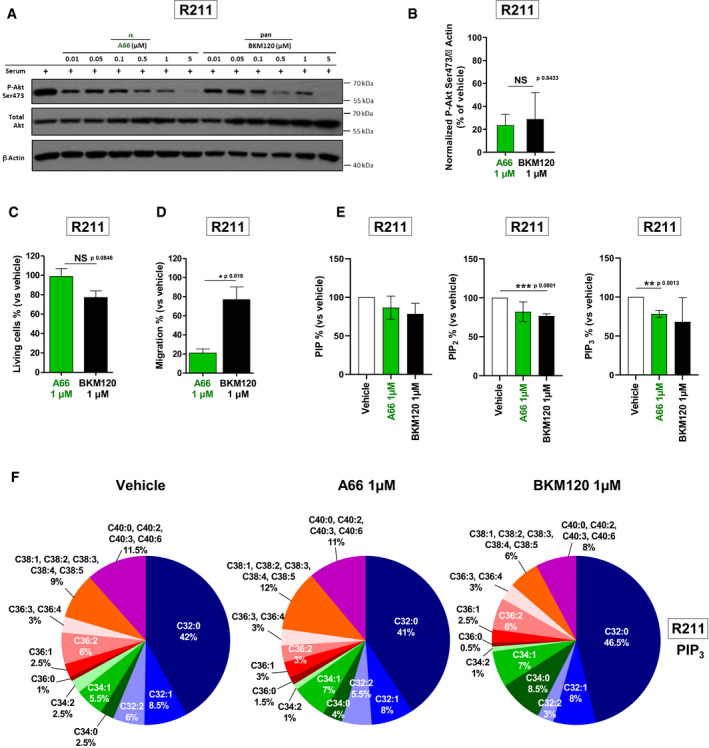
Figure 3. PI3Kα inhibition regulates selective PI‐3,4,5‐P3 species.

-
A, B(A) Murine pancreatic tumour cells R211 were treated for 15 min with the vehicle, α‐specific A66 or pan‐PI3K inhibitor BKM120 at 0.01, 0.05, 0.1, 0.5, 1 or 5 µM in the presence of 10% FBS and protein levels of PAkt (Ser473), total Akt and β Actin were observed by Western blot. (B) PAkt on Ser473 was quantified and normalised with β Actin. n = 3 in each group.
-
C, DR211 cells were treated with the vehicle, α‐specific inhibitor A66 or pan‐PI3K inhibitor BKM120 at 1 µM and (C) living cells were quantified after 3 days with a MTT colorimetric assay or (D) migrating cells were quantified after 24 h in a Boyden chamber assay and compared to vehicle (DMSO). n = 3 in each group.
-
EMurine pancreatic tumour cells R211 were treated for 15 min with the vehicle (0.01% DMSO) or α‐specific A66 or pan‐PI3K inhibitor BKM120 at 1 µM. Phospholipids were extracted, total PIP, PIP2 and PIP3 were quantified and compared to the vehicle (DMSO). n = 3 in each group.
-
FThe proportion of each PIP3 subtype was represented. Subtypes whose proportion was modified compared to DMSO were underlined. n = 3 in each group.
Data information: Mean ± SEM (*P < 0.05, **P < 0.01, ***P < 0.001, n ≥ 3 independent experiments, Student’s t‐test).
