Figure 4.

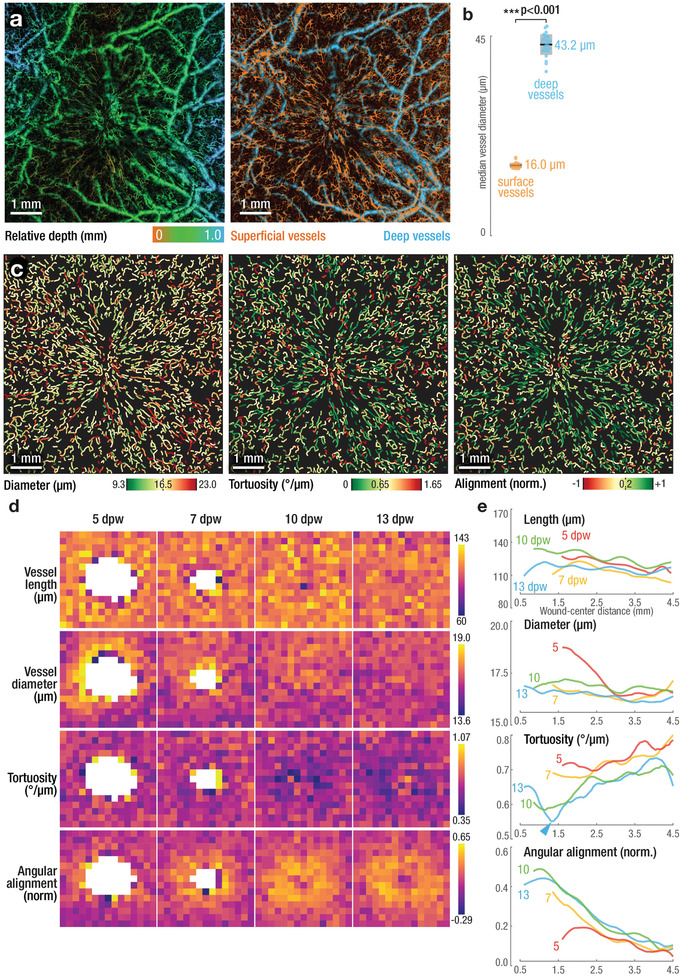
Automatic, high throughout, and quantitative analysis of vessel and network morphology based on volumetric LSOM imaging enables entirely non‐invasive measures of wound re‐vascularization. a) Depth‐resolved, volumetric LSOM datasets (left panel) were automatically segmented into superficial and deep vasculature (orange and blue, respectively, in the right panel) for subsequent analysis. b) Comparison of vessel sizes reveals significant differences between shallow vessels in the dermis when compared to arterioles and venules situated deeper in the interstitial connective tissue (n = 28 wounds; Student's t‐test, p = 4.8 × 10−51). Dots represent median vessel diameter of individual wounds; black lines represent mean values; gray boxes represent 95% confidence intervals. c) Automatic vessel analysis extracts vessel parameters for thousands of individual vessels per wound (average of 1547 ± 93 vessels). Exemplary visualizations of vessel diameter (left panel, mean diameter = 16.5 µm), tortuosity (middle panel, mean tortuosity = 0.65° µm−1), and vessel alignment (right panel, mean alignment = 0.2; higher values indicate vessel alignment toward wound center). d,e) Vessel parameters (length, diameter, tortuosity, and angular alignment) for all wounds over the time course of healing (n = 10, 8, 6, and 4 wounds for 5, 7, 10, and 13 dpw, respectively). Heat maps (d) empower a qualitative assessment of aggregated spatial vascular alterations, while representation relative to their distance from the wound center (e) allows evaluating changes over the wound time course. Wound healing appears to be fueled by changes in tortuosity and alignment, rather than length and diameter of the vessels. Heat map size 6 mm x 6 mm, binning size 400 µm x 400 µm. See Experimental Section for definition of tortuosity and alignment. Panels (a) and (c) show exemplary data of a wound at 13 dpw.
