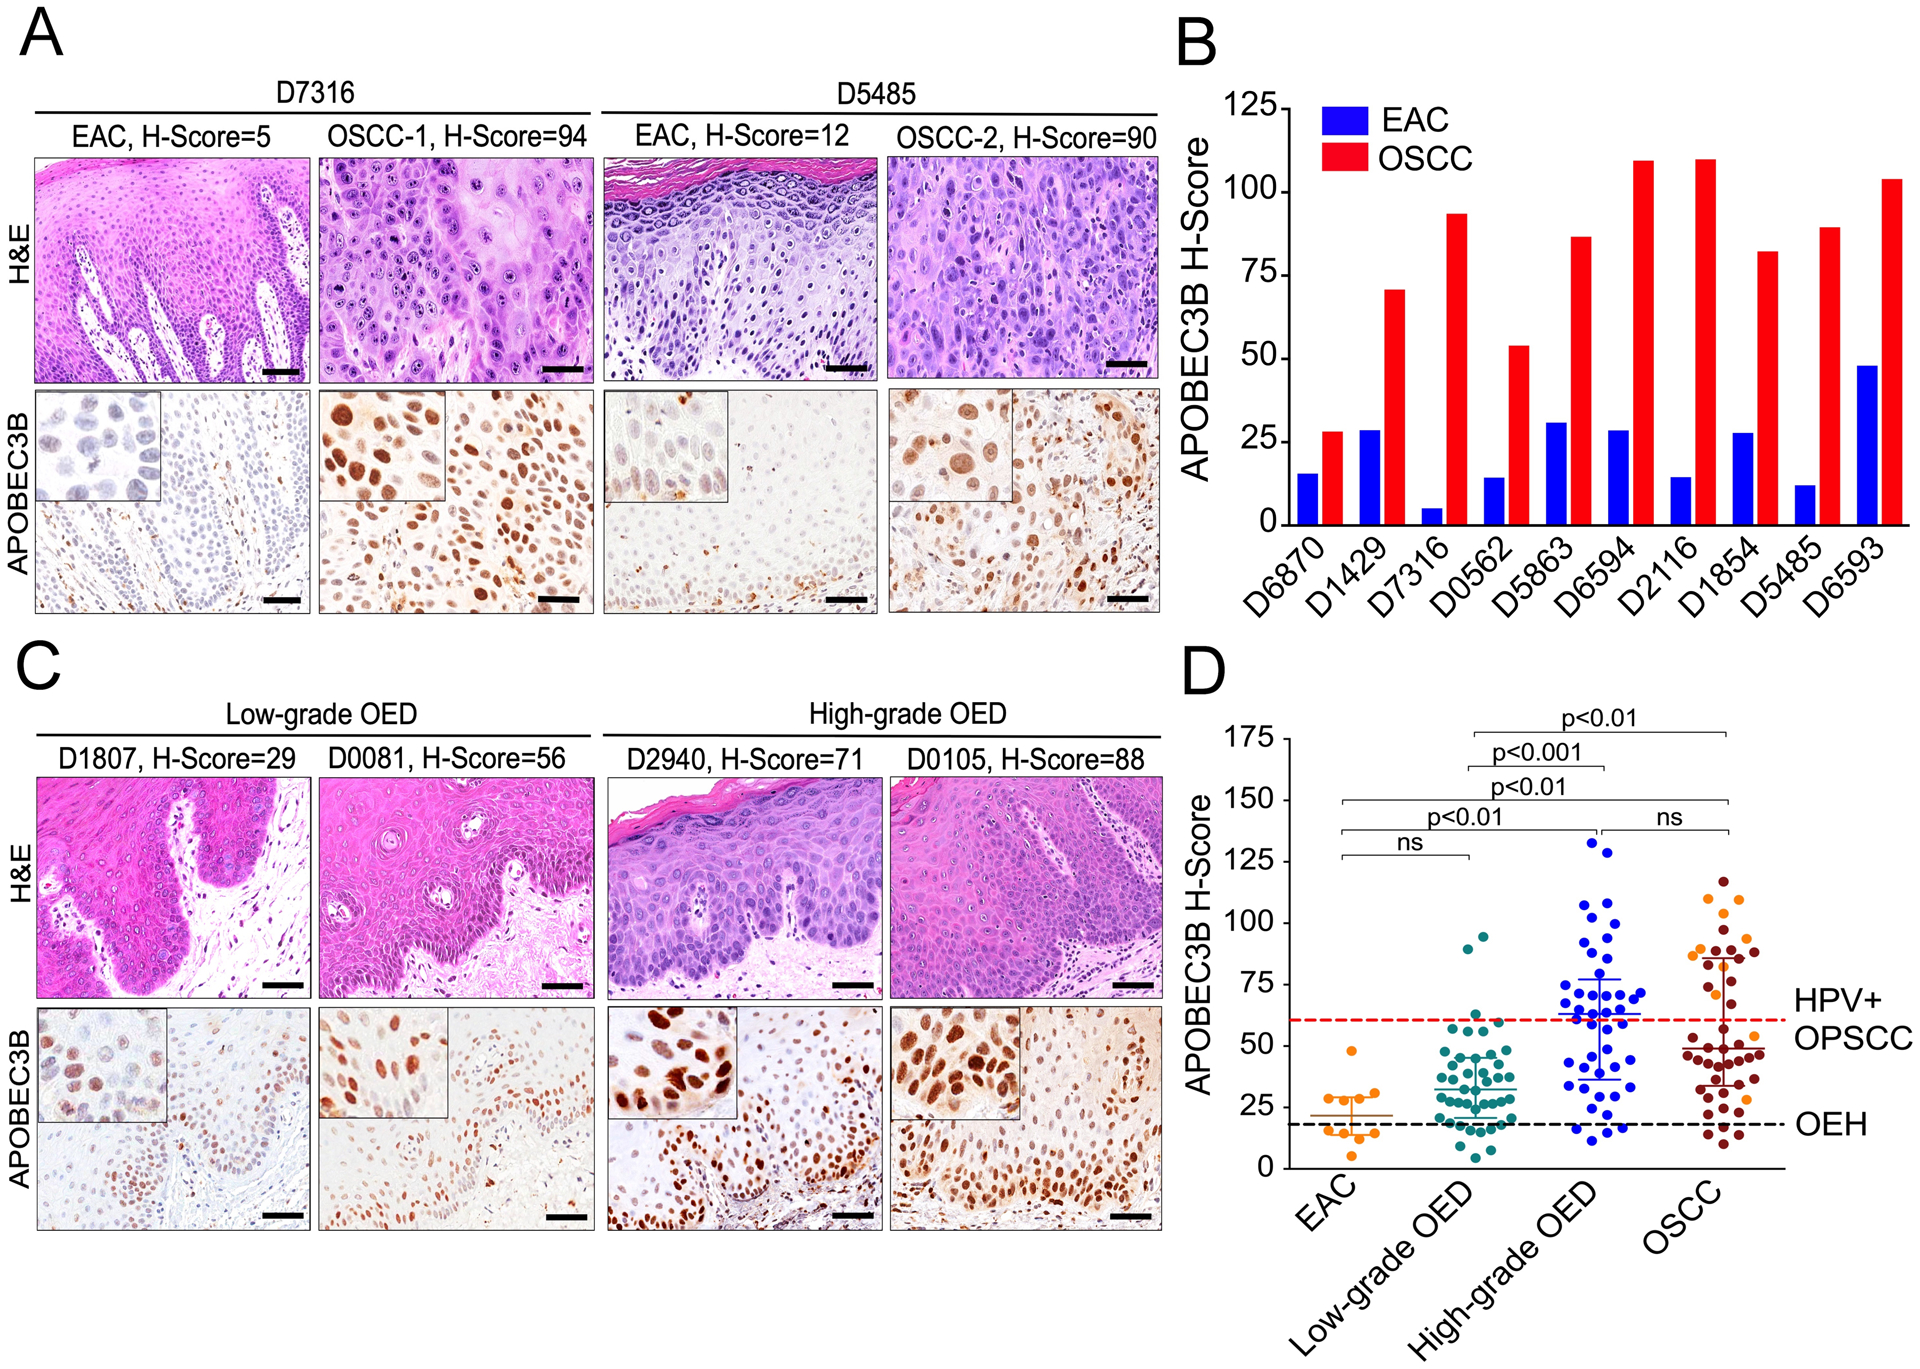
Fig. 2. A3B levels increase during progression of HPV-negative oral carcinogenesis.

(A) A3B staining and corresponding H&E-stained photomicrographs of representative oral squamous cell carcinomas (OSCC) and paired, non-neoplastic, epithelial tissues adjacent to cancer (EAC). Scale bars are 60 μm and inset images are magnified 4-fold.
(B) A3B H-scores in 10 pairs of EAC and patient-matched OSCCs. Collectively, A3B expression was significantly higher in OSCCs than EAC (p<0.01 by Wilcoxon signed-rank test).
(C) Histopathologic and A3B immunophenotypic characteristics of representative examples of low- and high-grade, oral epithelial dysplasias (OED). Scale bars are 60 μm and inset images are magnified 4-fold.
(D) Collective presentation of quantified A3B H-scores of EAC (n=10), low-grade OED (n=43), high-grade OED (n=45) and OSCC (n=46). The black horizontal dotted line indicates the OEH (control) A3B median (18.4), while the red one the A3B median (60) of HPV-positive OPSCC. Use of same color highlights matched pairs of EAC and OSCC. The H-score median and interquartile range for each group are shown and statistical significance for key comparisons is indicated (Kruskal-Wallis test).
