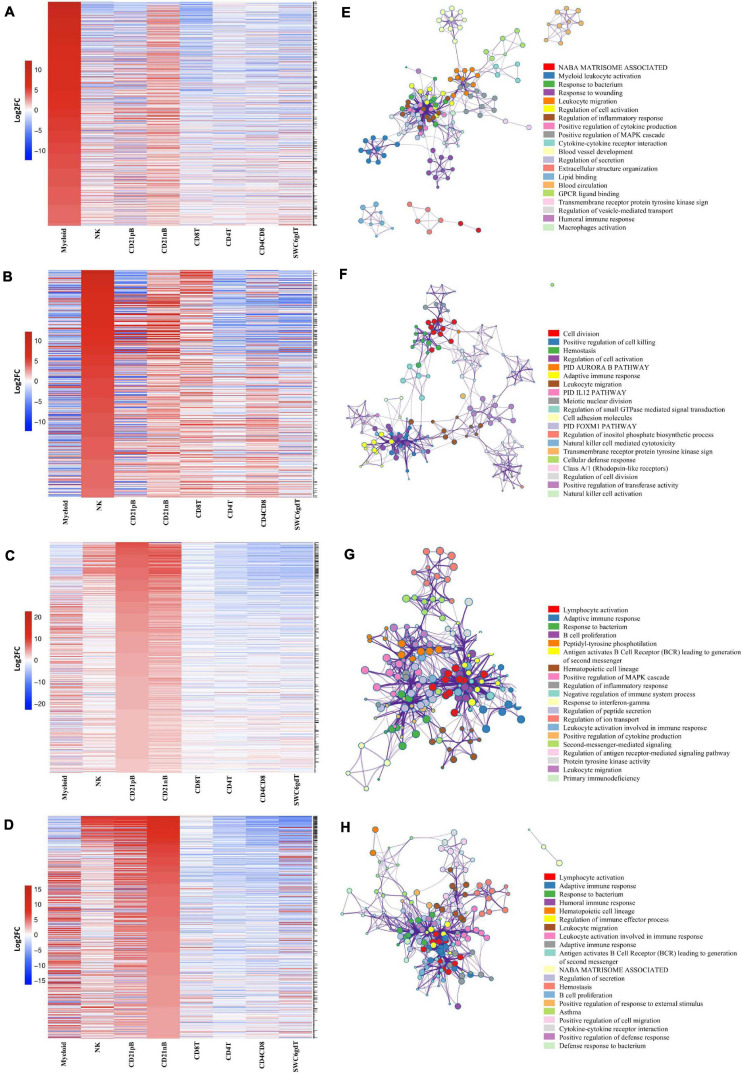
FIGURE 3.
Top 25% highly enriched genes in CD3– sorted cells. Heatmap showing in decreasing order the top 25% of highly enriched genes in (A) myeloid, (B) NK, (C) CD21pB, and (D) CD21nB-cells. Ontology enrichment clusters of the top 25% highly enriched genes of (E) myeloid, (F) NK, (G) CD21pB, and (H) CD21nB cells. The most statistically significant term within similar term cluster was chosen to represent the cluster. Term color is given by cluster ID and the size of the terms is given by –log10 p-value. The stronger the similarity among terms, the thicker the edges between them.

