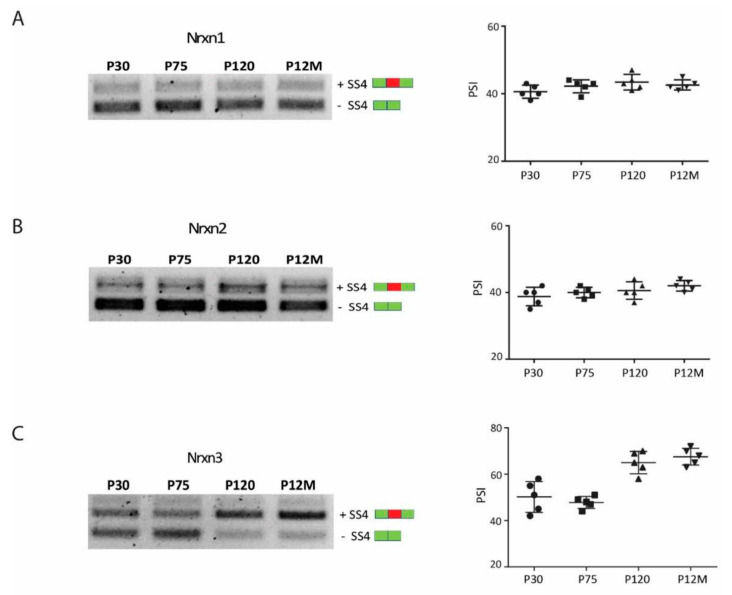
Figure 3.
Neurexins splicing pattern in postnatal frontal cortex. RT-PCR analysis of Nrxns splice variants at SS4 in FC of mice at different ages: P30, P75, P120, and P12M (n = 5 mice for each group). Representative splicing pattern of Nrxn1 (A) Nrxn2 (B), and Nrxn3 (C). On the right, the corresponding scatter plots shows the densitometric analysis (ImageJ-win64) expressed as PSI (percent spliced in). The splicing pattern for Nrxn1–2 does not change during age, while Nrxn3 shows an increase in the +SS4 isoform from adult age. Statistical analysis was performed by ordinary one-way ANOVA. Error bars represent SD. Green box: constitutive splice site. Red box: alternative splice site.

