
Figure 5. Ultrastructure of the ER during prometaphase imaged with 3D correlative fluorescence and electron microscopy. See also Figures S5 and S6.
(A) 3D FIB-SEM of parental SUM159 cells during prometaphase illustrates fenestrations in ER sheets. Enlarged views are from boxed region. The yellow arrows point to fenestrations within the segmented ER sheet; the white arrows, to fenestrations at the intersection of the orthoslice and the segmented membrane. Scale bars, 1 um and 200 nm.
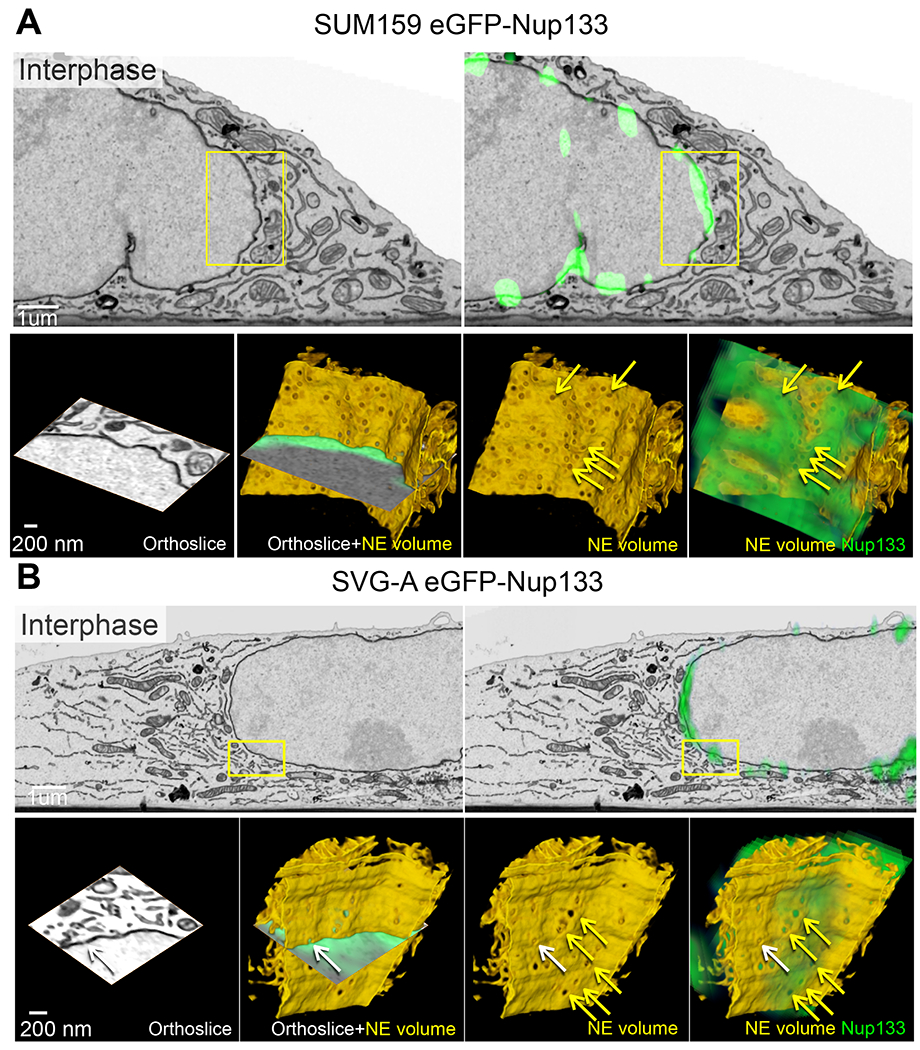
(B, C) Correlative 3D spinning disc confocal fluorescence imaging with FIB-SEM-CLEM of genome-edited SUM159 (B) and SVG-A (C) expressing eGFP-Nup133 during prometaphase shows colocalization of fluorescence (green) from eGFP-Nup133 with fenestrations in ER sheets. Enlarged views in (B,C) are from boxed regions; enlarged boxed regions in (C) are rotations from the en-face views. The yellow arrows point to fenestrations within the segmented ER sheet; the white arrows, to fenestrations at the intersection of the orthoslice and the segmented membrane. Larger green spots within the nuclear region are projected signals from adjacent kinetochores. Scale bars, 1 um and 200 nm for (B) and 2 um and 200 nm for (C), respectively.