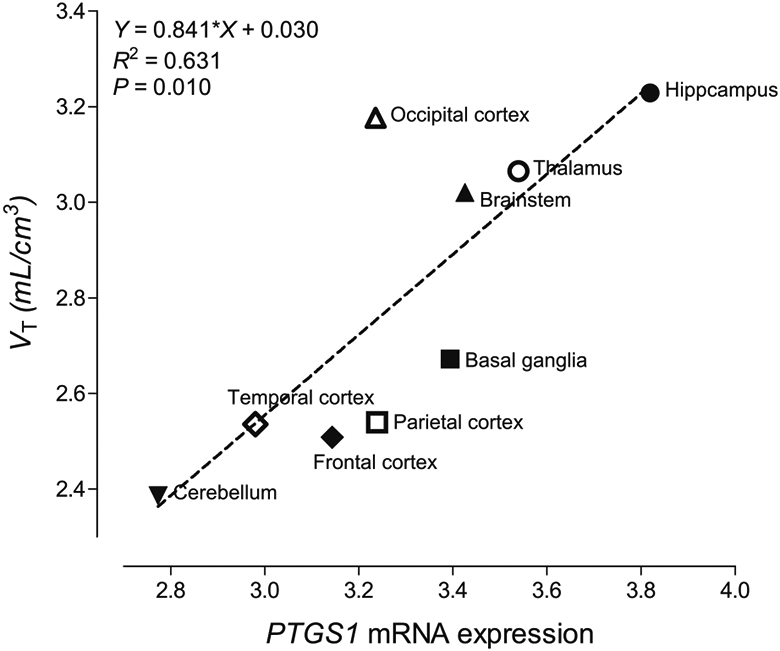
Fig. 5.

Correlation between in vivo brain total distribution volume (VT) of [11C]PS13 (n = 10) and ex vivo PTGS1 mRNA expression levels measured by probe A_24_P64167 provided in the Allen Human Brain Atlas (n = 6). Please note that, although [11C]PS13 binding is higher in pericentral cortices, the VT values of the parietal and frontal regions are not particularly high because they derive from a larger region encompassing the whole lobe
