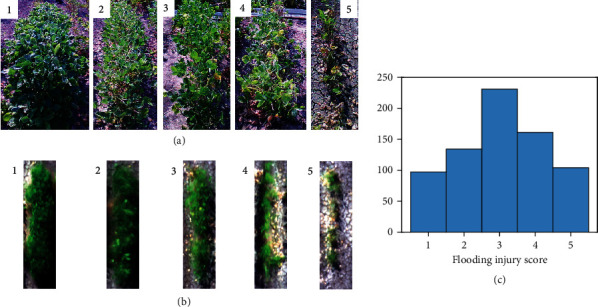
Figure 2.

Representative images of soybean plots of different flooding injury scores (FISs). (a) Images were taken using a consumer-grade camera show example soybean plots at 1-5 level of FISs. (b) Soybean plots of different FISs show differently at the UAV images composing of the red, green, and blue channels from the multispectral images. (c) Histogram of the visually observed FISs for 724 soybean plots.
