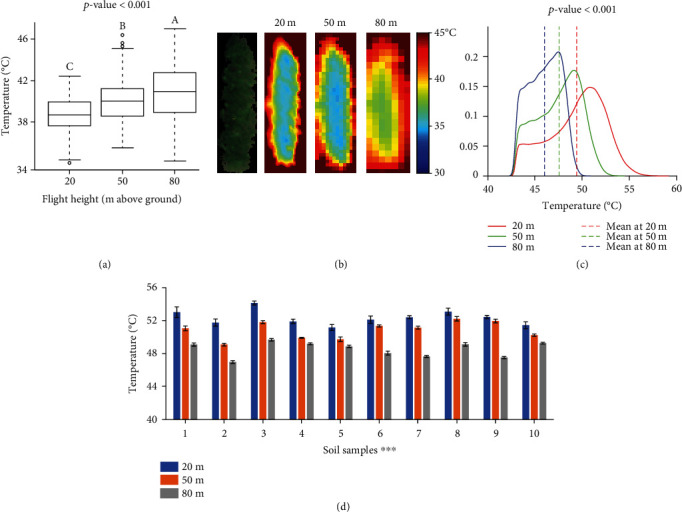
Figure 5.

The comparisons of canopy temperature measured at three flight heights. (a) The boxplots of soybean canopy temperature were collected at three flight heights. The end of the boxes defines the 1st and 3rd quartile, with a plot at the median and error bars defining the 10th and 90th percentiles. The lowercase letters above bars indicate the significant difference among these means at a 0.05 significance level. (b) An RGB image of a soybean plot captured by the multispectral camera at 20 m and its thermal images at three heights. (c) Density plots of the temperature values of soil at three heights. (d) Column plots of the temperature values of ten soil samples that were manually cropped from the thermal images at three heights. ∗∗∗ indicates a significance level of p = 0.001.
