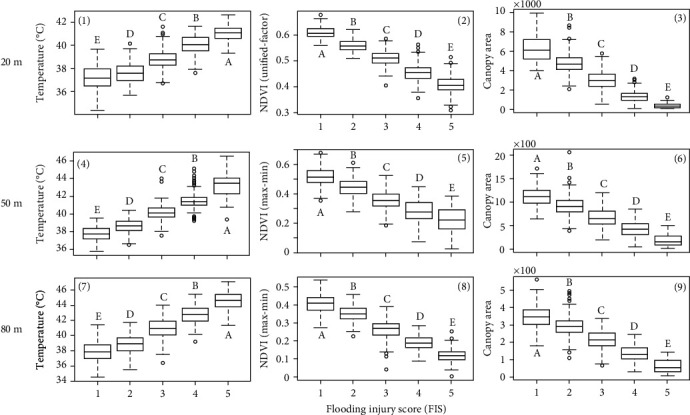
Figure 7.

Relationships between three image features and FIS. (1)–(3) are the boxplots of temperature, NDVI, and canopy area at 20 m. (4)–(6) are those at 50 m. (7)–(9) are those at 80 m. The NDVI values at 50 and 80 m were calculated using the reflectance values converted by the max-min method. The lowercase letters above bars indicate the significant difference among these means at a 0.05 significance level.
