
Figure 8.
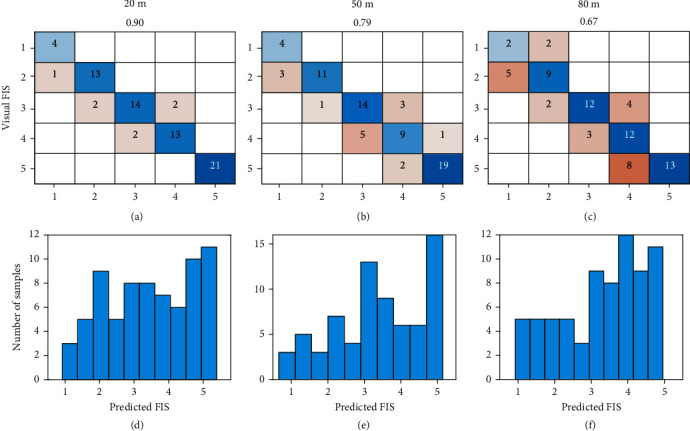
Classification performance of the FNN model with canopy temperature, NDVI, canopy area, length, and width collected at three flight heights. (a–c) are confusion tables of the five-level FIS. (b–f) are histograms of the predicted FIS in testing sets.