. 2021 May 17;12(26):9078–9087. doi: 10.1039/d1sc01310f

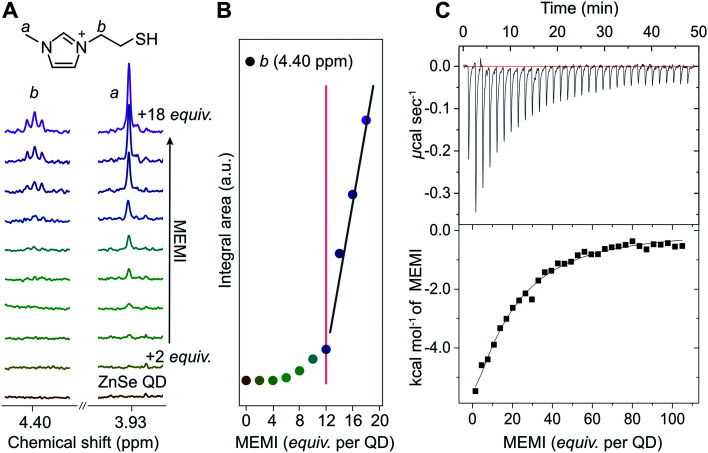
Fig. 2. (A) 1H-NMR spectroscopy titration experiment with aliquots of MEMI being added to a D2O suspension of 5 μM ZnSe–BF4 QDs (2 equiv. (mol MEMI per mol QD) per step). Selected signals (4.40 and 3.93 ppm) are shown for clarity. (B) Plot of integral area from NMR experiments vs increasing MEMI loading from the NMR experiments. The signals characteristic for MEMI (i.e., 4.4 ppm) start to disappear at <12 equiv. per ZnSe–BF4 QD, suggesting that a ZnSe–BF4 QD is able to accommodate approximately 12 MEMI molecules. Additional data and the full spectra are shown in the ESI (Fig. S2 and S3). The fitted lines aim to help guide the eye. (C) ITC curve and plot obtained by titration of MEMI (0.5 mM) into an aqueous ZnSe–BF4 QD solution (1 μM).

Fig. 2