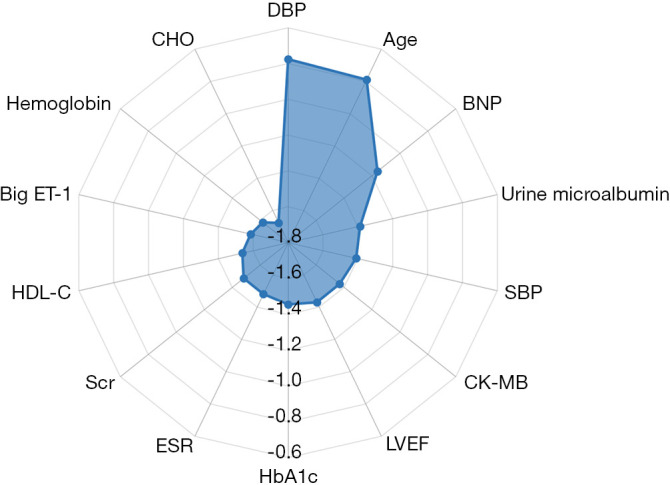
Figure 4.

Feature selection. Information gain ranking was used to evaluate the worth of each variable by measuring the entropy gain with respect to the outcome. The importance of each feature was quantified by calculating the decrease in the model’s performance after permuting its values. The higher its value, the more important the feature is. As the feature importance values were spread over a wide range (multiple orders of magnitude), base-10 logarithmic transformation was performed to facilitate plotting. The top 15 variables in the random forest model were shown. DBP, diastolic blood pressure; BNP, B-type natriuretic peptide; SBP, systolic blood pressure; CK-MB, creatine phosphokinase-isoenzyme-MB; LVEF, left ventricular ejection fraction; HbA1c, haemoglobin A1c; ESR, erythrocyte sedimentation rate; Scr, serum creatinine; HDL-C, high-density lipoprotein cholesterol; Big ET-1, big endothelin-1; CHO, cholesterol.
