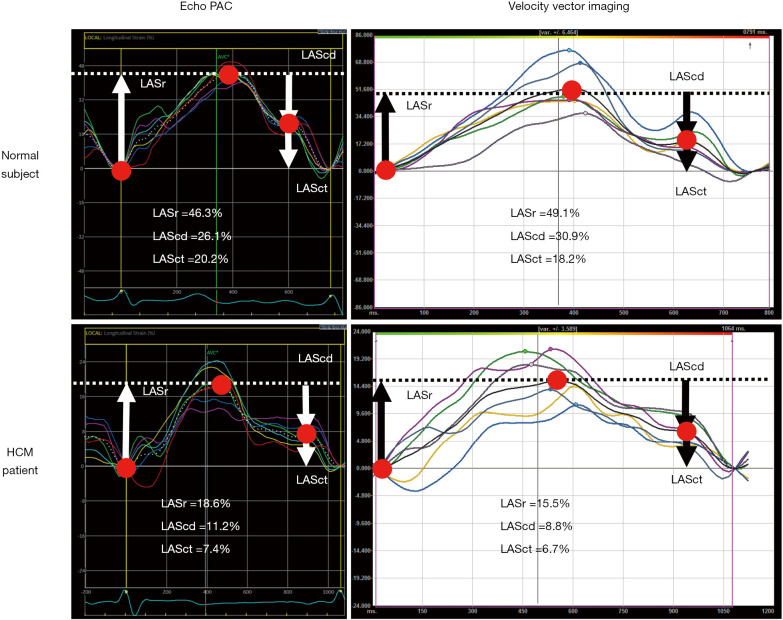
Figure 2.
LA strain mechanics through the different phases of the cardiac cycle in a normal subject (top panel) compared to a patient with HCM (bottom panel). The series of images on the left represent strain measurements by EchoPAC (GE Healthcare, Chicago, IL, USA)] software, while the series of images on the right represents measurements by velocity vector imaging (Siemens Healthineers, Washington, DC, USA). The illustration also highlights the differences in LA strain values obtained, depending on the type of software platform used. LA, left atrial; HCM, hypertrophic cardiomyopathy; LASr, LA reservoir strain; LAScd, LA conduit strain; LASct, LA contractile strain.

