. 2021 May 27;12(26):9207–9220. doi: 10.1039/d1sc02194j

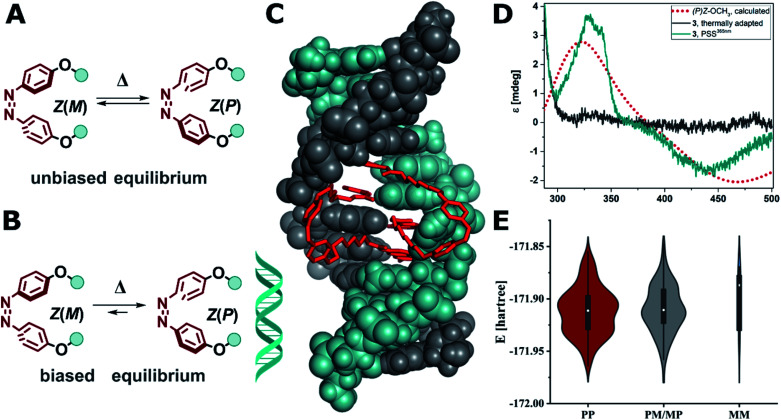
Fig. 8. (A) Unbiased equilibrium of interconverting helical conformers. (B) DNA-induced biased equilibrium favoring Z(P) configuration in the alkoxy azobenzene-based MBLs 2–4. (C) Calculated structure of Z-3 in DNA (note two molecules of Z-3 bind to form stable dsDNA). (D) Experimental CD spectrum of compound 3 (10 μM) in the presence dsDNA (5′-d(CTAACGGAATG)-3′/3′-d(GATTGGCTTAC)-5′, 5 μM) in phosphate buffer at the thermal equilibrium (grey solid line) and after EZ isomerization at the PSS365nm (cyan solid line), which corresponds well with the computed CD spectrum of Z(P)-OCH3 (red dotted line, TD(25 states)-PBE0/6-311+G(2d,p) level of theory using the SMD implicit model for water). (E) Violin plot of the energy and distribution of two molecules of Z-3 in a 2 : 1 complex to mismatched DNA adopting (PP)Z, (PM/MP)Z, and (MM)Z configuration (for details see ESI, Section 6.3).

Fig. 8