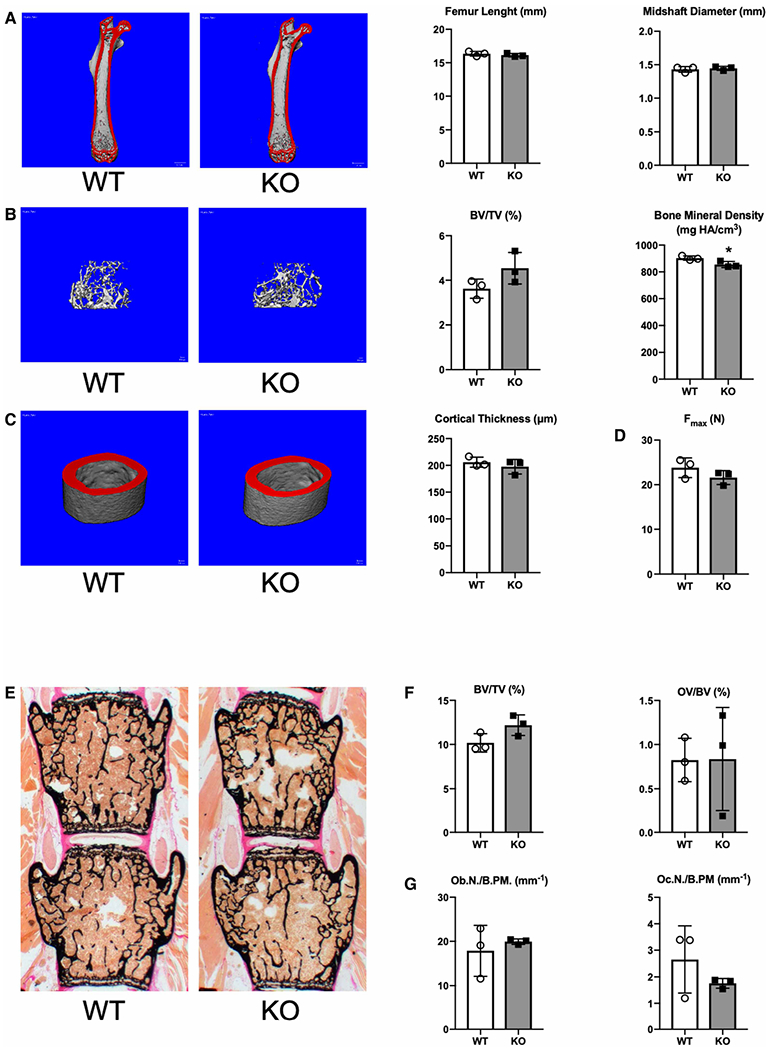
Figure 6. Arsk-deficient mice exhibit no obvious skeletal phenotype.

(A) Representative μCT images of femora from 24-week-old wildtype and Arsk-deficient mice. Mineralized bone appears in red. Quantification of the femoral length and midshaft diameter is given on the right. (B) Representative μCT images of trabecular bone from the same mice. Quantification of the bone volume per tissue volume (BV/TV) and the bone mineral density is given on the right. (C) Representative μCT images of cortical bone from the same mice. Quantification of the cortical thickness is given on the right. (D) Quantification of the maximal force (Fmax) to failure in three-point-bending assays of the femoral bones. (E) Representative Kossa-stained sections of vertebral bodies (L3 and L4) from 24-week-old wildtype and Arsk KO mice. Mineralized bone appears in black. (F) Quantification of bone volume per tissue volume (BV/TV) and osteoid volume per bone volume (OV/BV). (G) Quantification of osteoblast (Ob.N./B.Pm.) and osteoclast number (Oc.N./B.Pm.) per bone perimeter. All data represent mean ± SD (n = 3). The asterisk indicates a statistically significant difference (*P < 0.05) between the two groups.
