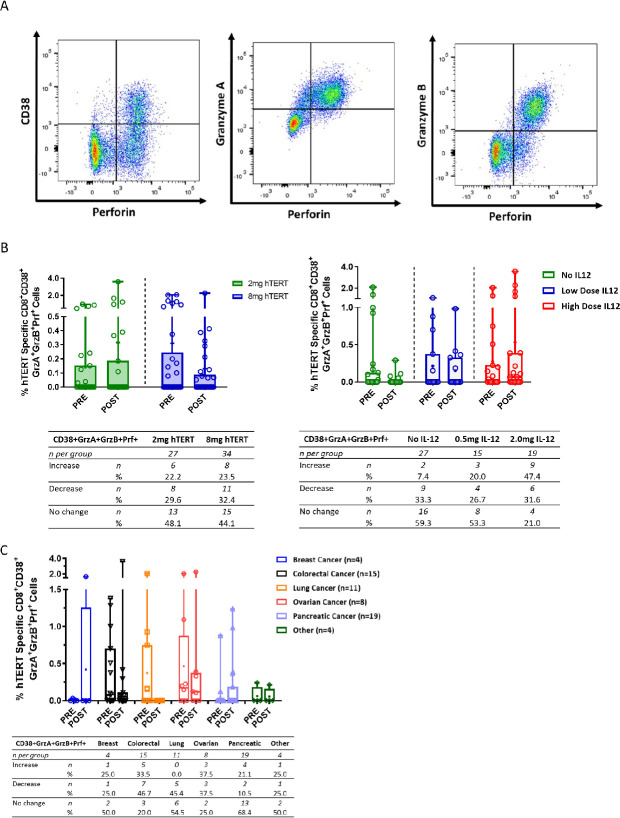
Figure 4.
Activated CD8 +T cells with lytic potential broken out by hTERT dose, IL-12 dose and cancer type. (A) Representative dot plot showing CD8 +T cells expressing the activation marker CD38 and lytic granules—perforin, granzyme A and granzyme B. (B, C) Open symbols represent individual patients, the mean is represented with ‘+’, the box extends from 25 th to 75 th percentile, line inside the box is a the median, and the whiskers extend from the minimum to maximum values. Wilcoxon signs rank test was used to assess significance between the magnitude of IFN-g in patients before (PRE) and after (POST) immunotherapy. The number and per cent of patients in each group that had an increase, decrease or no change from baseline is displayed below each graph. hTERT, human telomerase reverse transcriptase; IFN, interferon; IL-12, interleukin.

