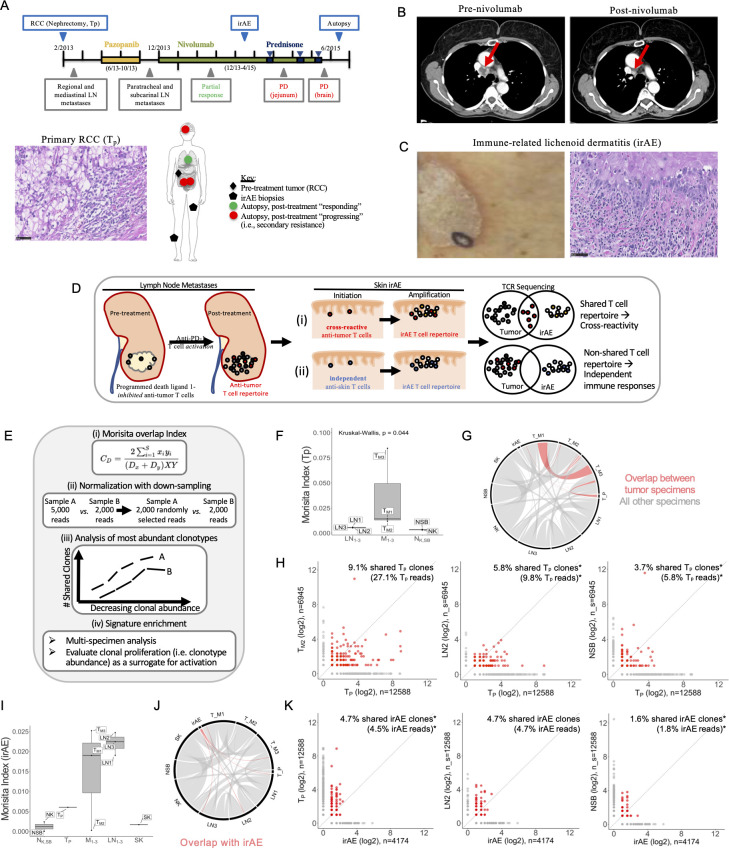
Figure 1.
Clinical course and assessment of TCR repertoire overlap among tumor specimens and the irAE. (A) Timeline shows the clinical course from RCC resection to autopsy. Therapies included pazopanib (yellow bar), nivolumab (green bar), and prednisone (blue bars), with treatment dates shown below the bars. Radiographical assessments (gray boxes) included mediastinal metastases with partial response to nivolumab followed by PD in the bowel and brain. Tissue specimens collected (blue boxes) included the resected RCC (photomicrograph shown), biopsies of the immune-related lichenoid dermatitis (irAE), and multiple specimens collected at the time of rapid autopsy (see online supplemental table S1). The anatomical sites of the collected specimens are illustrated, including the primary renal tumor (black diamond), two sites of irAE (black pentagons), mediastinal LNs at the site of tumor regression (green circles) and progressing lesions in the jejunum, mesentery, and brain (red circles). (B) Intravenous contrast-enhanced CT of the chest demonstrated right lower paratracheal adenopathy which resolves after nivolumab treatment (red arrow). (C) A photograph (left) and photomicrograph (right) of the irAE, the latter showing the brisk lichenoid lymphocytic infiltrate and necrotic keratinocytes. (D) Diagram illustrating two hypotheses for the development of irAEs following immune checkpoint blockade: (i) the cross-reactivity hypothesis proposed that T cells activated as part of the antitumor immune response cross-react at the site of the irAE; this would be supported by detection of overlapping TCR repertoire signatures between the tumor and irAE; (ii) in contrast, if the irAE and antitumor immune responses were independent of each other, it was unlikely significant TCR repertoire overlap between the two sites would be detected. All photomicrographs at ×400 magnification, scale bars 50 um. (E) Proposed approaches to maximize interpretive value and minimize confounding in TCR sequencing data analysis, including (i) the MI for quantifying global TCR repertoire sharing among multiple specimens in a sample size-independent manner, (ii) proportional downsampling for library size normalization to enable relative interpretations of clonal sharing, and (iii) normalization to relative clonal abundance in each specimen to assess relative sharing among the most abundant T-cell clones across multiple specimens. (F) The Morita index demonstrates that the three metastatic lesions consistently showed a greater degree of sharing with the Tp (MI median 0.014, range 0.012–0.088) relative to the normal control tissues (NSB MI 0.004, NK MI 0.003). (G) Chord diagram illustrates TCR repertoire overlap among the Tp and multiple post-treatment progressing metastases (red). Non-tumor specimens are shown in gray. (H) Following library size normalization, a metastasis (TM2, left), LN (LN2, middle), and NSB (right) were evaluated for T-cell repertoire overlap with the primary tumor (TP). Clonal expansion of clones shared with TM2 is suggested by 9.1% of shared TP clonotypes representing 27.1% of TP reads. Subsampled comparisons are indicated (*) and the 95% CIs for shared TP clones were 5.2% to 6.8% for LN2 (middle, representing 4.9%–15.8% total TP reads) and 3.3% to 4.3% for NSB (right, representing 3.5%–14.7% total TP reads). (I) The Morita Index demonstrates an overall low degree of TCR repertoire between the irAE and the other specimens, although the relative sharing with two of the three metastatic lesions (MI median 0.02, range 0.0003–0.026) and the three regression site LNs (MI median 0.025, range 0.021–0.027) was higher than with the normal tissues (NSB MI 0.00004, NK MI 0.003). (J) Chord diagram highlighting sharing with the irAE as assessed by the MI in red (sharing among other specimens shown in gray for reference). (K) Following library size normalization, pairwise quantification of shared clones shows that while 4.7% of irAE clones were shared with the primary tumor and a regression site LN (LN2, 95% CI 4.6% to 5.9% irAE clones), the shared clones were not expanded in the irAE (representing 4.5% and 4.7%, 95% CI 4.7% to 6.4% of the total irAE reads, respectively). Sharing between the irAE and NSB shown for comparison, 1.6% shared clones (95% CI 1.3% to 2.2%) represent 1.8% total irAE reads (95% CI 1.3% to 2.2%). Subsampled comparisons are indicated (*). (L) The GLIPH2 clustering algorithm was used to detect and quantify potential specificity clusters based on TCR CDR3 sequencing information. Motif clusters were included in downstream analysis if there were ≥3 unique CDR3s, ≥10 reads for each CDR3, a vb score <0.05, and a length score of <0.05. The barplot shows the clonal abundance of the significantly enriched ‘SSQD’ motif in the dermatitis and respective clonal abundance in other tissue compartments. GLIPH2, grouping lymphocyte interactions by paratope hotspots 2; irAE, immune-related adverse event; LN, lymph node; MI, Morisita Overlap Index; NK, normal tissues from the left kidney; NSB, normal small bowel; PD, progressive disease; RCC, renal cell carcinoma; SK, skin; TCR, T-cell receptor; Tp, pretreatment primary tumor.

