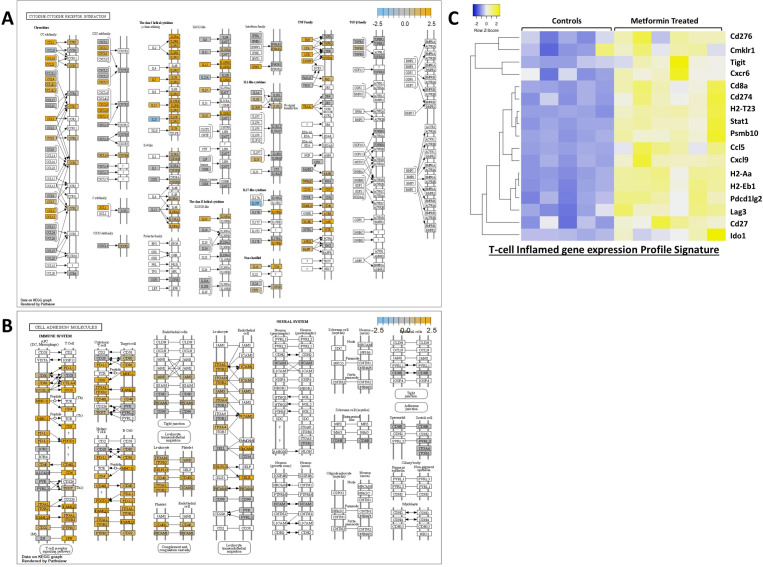
Figure 6.
Key pathways enriched following chronic metformin exposure. (A) Cytokine-cytokine receptor interaction pathway. (B) Cell adhesion molecules. This image was generated by overlaying the information of the differentially expressed genes in the metformin treated group from our panel on the KEGG pathway image. Genes with no significant differential expression are shown in gray, blue denotes downregulation and orange represents upregulation, whereas those genes in white are not present in our panel. KEGG, Kyoto Encyclopedia of Genes and Genomes. (C) Differential gene expression among control and metformin treated groups for 17 genes contained in T-GEP.

