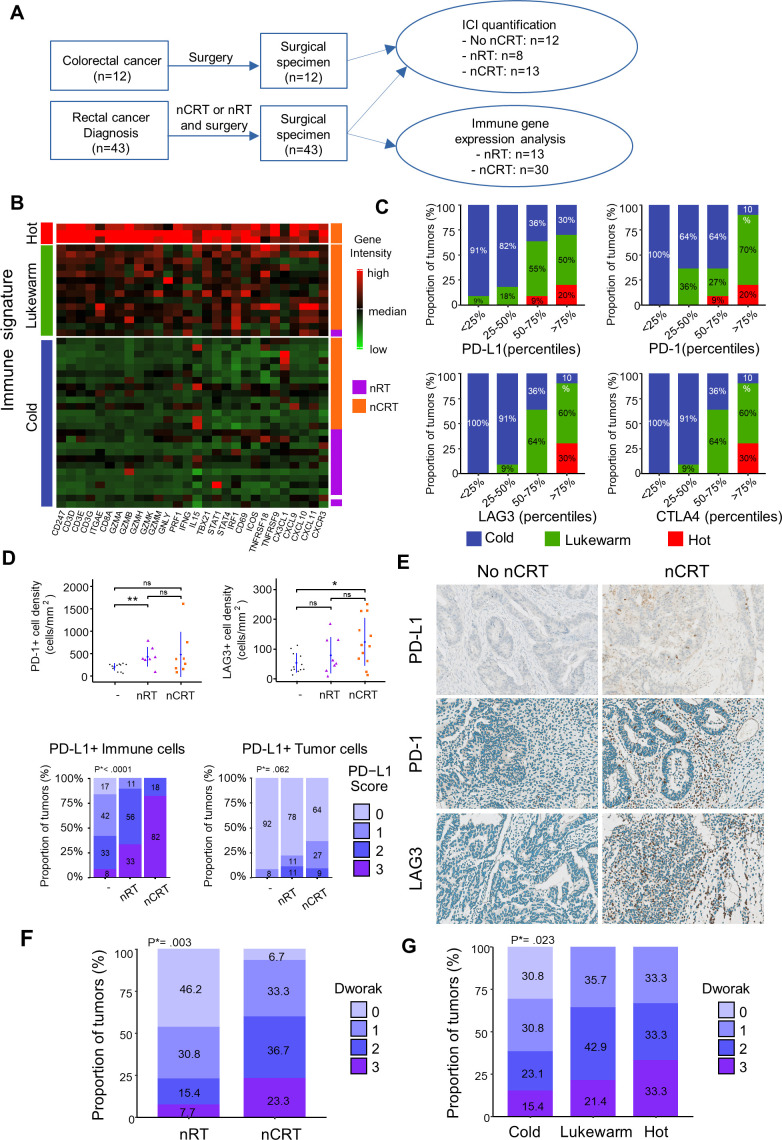
Figure 1.
Tumor-associated immune signatures of human rectal cancer treated by neoadjuvant chemoradiation (nCRT) versus neoadjuvant radiation (nRT). (A) Flow chart of experimental design. (B) T cells related gene expression heatmap clusterised by partitioning around medoids algorithm in patients with rectal cancer treated by nRT or nCRT. Low and high expression of genes is represented with a color gradient from red to green. (C) Percentage of hot (red), lukewarm (green) and cold (blue) tumors in ICI gene intensities categorized in quartiles. (D) Mean±SEM of PD1+ and LAG3+ cell densities in patients not treated, treated with neoadjuvant RT or CRT treatment (Upper part). Proportion of PD-L1 score level quantified in immune or tumor cells in patients not treated, with neoadjuvant RT or CRT treatment. Φ PD-L1 score in immune cells: 0:<1%, 1: 1%–5%, 2: 5%–10%, 3:>10%. PD-L1 score in tumors cells: 0:<1%, 1: 1%–5%, 2: 5%–50%, 3:>50 (lower part). (E) Examples of immunostained for PD-L1, PD1 and LAG3 rectal tumors treated or not by nCRT. (F) Boxplots of histopathological responses to nCRT (Dworak 0 to 3) in patients treated with nRT or nCRT. (G) Boxplots of histopathological responses to nCRT in cold, lukewarm, and hot tumors. Wilcoxon test p values *<0.05 and **p<0.01. ICI, immune check point inhibitors. P*=Unilateral linear-by-linear association test.

