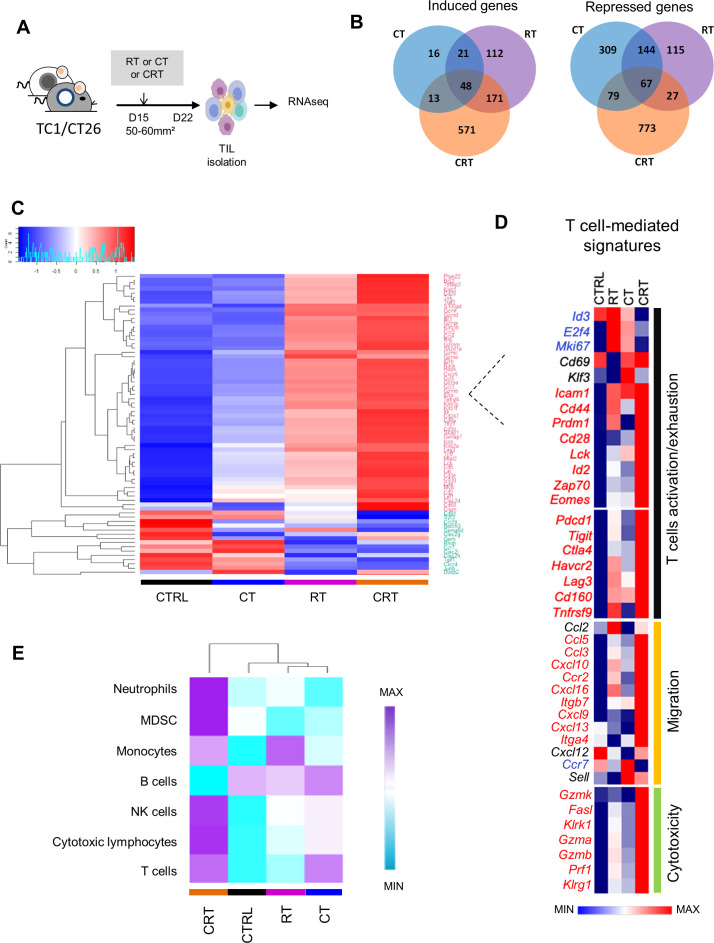
Figure 2.
Comparison of transcriptomic immune signatures of mouse tumor microenvironment exposed to chemoradiation (CRT) or radiotherapy (RT) or chemotherapy (CT). (A) C57BL/6NCrl, and BALB/cAnCrl mice were injected subcutaneously with 2.105 TC1-HPV16+ and CT26 colon tumor cells, respectively. Mice were treated with CT, RT, or CRT when the tumors reached 50–60 mm² (n=10 mice/treatment group, 3 experiments). (B) Number of differentially expressed genes (DEGs) regulated in tumor-infiltrating lymphocytes (TILs) from each treatment group. TILs were harvested 7 days after CRT. The different treatments regulated a total of 2466 DEGs (a log2-fold change (FC) in expression with treated mice versus control (CTRL)≥3 or ≤−3); 1344 (55%), 552 (22%), and 536 (22%) were regulated following CRT, RT or CT, and ≥2 treatments, respectively. (C) Heatmap showing log10 normalized Fragments Per Kilobase of transcript per Million mapped reads (FPKM) of DEGs related to T-cell expressed in TILs from CTRL, RT, CT and CRT-treated TC1-bearing mice (n=6 mice/treatment group). Gene set enrichment analysis was performed using the PanglaoDB gene specific genes sets. Twenty-seven gene sets with more than 10 genes in a cluster and presenting a corrected p-value below 0.01 were selected. (D) Heatmap depicts log2 normalized FPKM of DEGs related to T cells-related exhaustion, activation, migration and cytotoxicity signature expressed in TILs from CTRL, RT, CT and RTCT mice (pool of 6 mice/group). (E) The absolute abundance of immune cell populations quantified by Microenvironment Cell Populations counter R package in TC1 tumor-bearing mice ((CTRL (untreated mice), CRT, RT, CT); a pool of TILs from at least 6 mice/condition).

