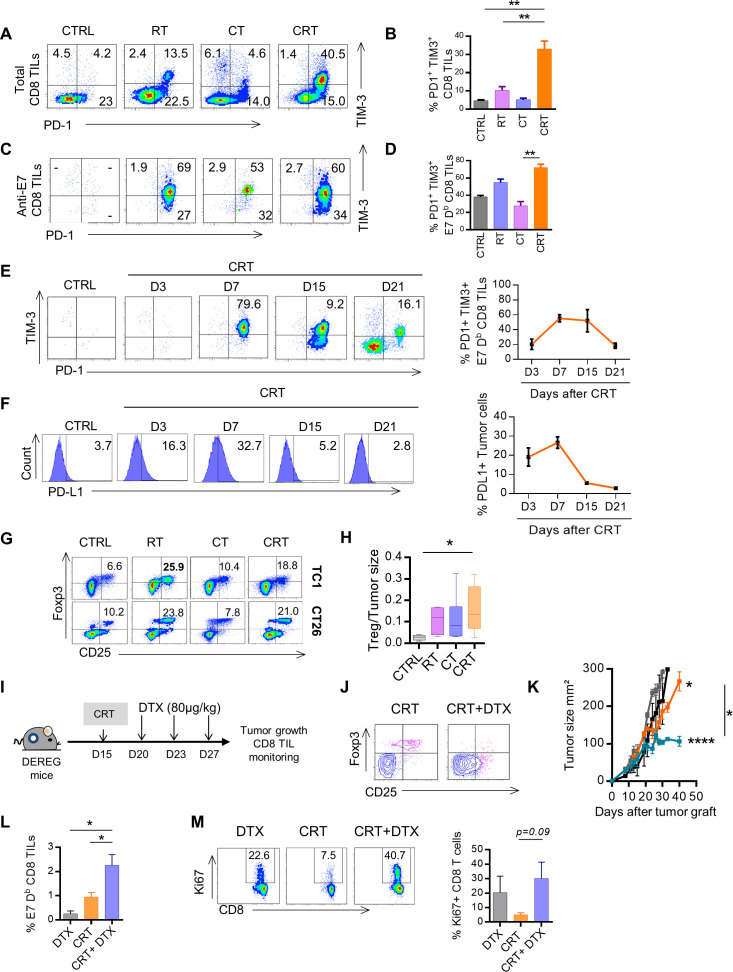
Figure 5.
Triggering of adaptive immune resistance and functional Tregs after chemoradiation (CRT). (A) Representative flow cytometry dot plots of PD1 and TIM3 expression on total CD8+ tumor-infiltrating lymphocyte (TILs) and on E749-57 specific CD8+ TILs in CTRL, radiotherapy (RT), chemotherapy (CT) and CRT-treated mice 7 days post treatment. (B) Histograms showing percentages of the PD1 and TIM3 coexpressing CD8+ TILs (data expressed as means±SEM). (C) Representative flow cytometry dot plot graphs of PD1 and TIM3 expression on E749-57 specific CD8+ TILs in CTRL, RT, CT and CRT-treated mice 7 days post treatment. (D) Histograms showing percentages of the PD1 and TIM3 coexpressing E749-57 specific CD8+ TILs (data expressed as means±SEM). (E) Flow cytometry dot plot graphs of PD1 and TIM3 coexpression on E749-57 specific CD8+ TILs assessed at days 3, 7, 15, and 21 post CRT (left) and percentages associated (right) from TC1. (F) Flow cytometry dot plot graphs of PD-L1 expression (left) and percentages associated (right) in TC1 model. (G) Representative flow cytometry dot plot graphs of TC1 (top) and CT26 (bottom)-infiltrating CD25high CD4+ Foxp3+Treg cells and the percentages/tumor size ratio according to the CTRL, RT, CT and CRT groups (left). (H) Percentages/tumor size ratio of CD25high CD4+ Foxp3+Treg cells in TC1-bearing mice. Data are representative of 2–3 experiments in each tumor model and are expressed as means±SEM; n=5–6 mice/treatment group. The Kruskal-Wallis test were used; **p<0.01. (I–M) Depletion of Regulatory T cell (DEREG) mice (n=5/treatment group) were injected with 2.105 TC1 cells and were treated or not treated with CRT. Treg cells were conditionally depleted using diphtheria toxin (DTX). (I) Schedule of DTX injections is shown. (J) Representative flow cytometry dot plot graphs of Treg cells in mice treated with CRT with or without DTX. (K) Scatter plots showing tumor growth in DEREG mice treated with CRT with or without DTX. Data are representative of two independent experiments; n=5–6 mice/treatment group. (L) Representative dot plot graphs of E749-57 specific CD8+ TILs (top) from the DTX, CRT, and CRT plus DTX-treated mice (left) and associated percentages (right). (M) Representative flow cytometry dot plot graphs showing of Ki67 expression on CD8+ TILs (left) and associated percentages (right). Data are representative of two independent experiments and are expressed as means±SEM; n=5–6 mice/treatment group. The one-way analysis of variance and Kruskal-Wallis tests were used; *p<0.05,**p<0.01,***p<0.001.

