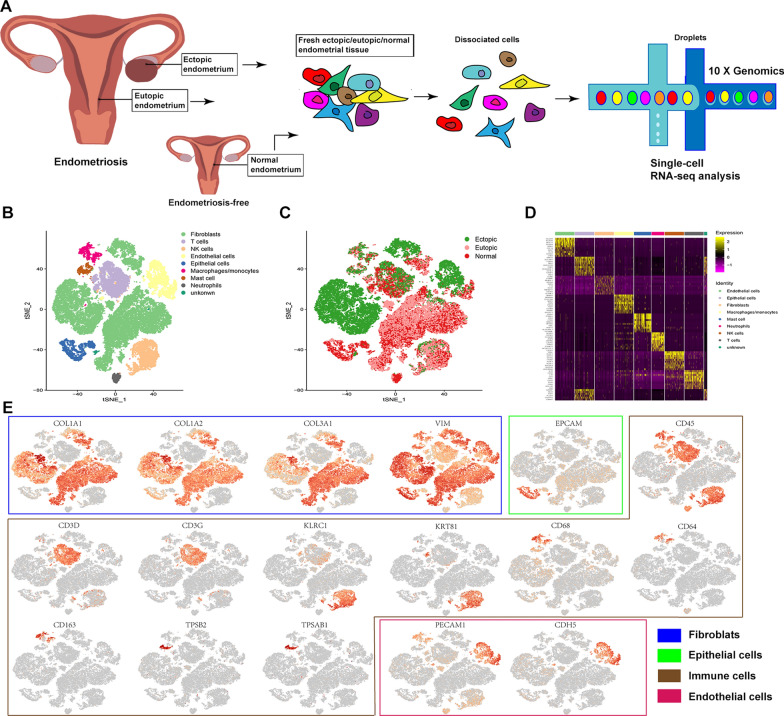
Fig. 1.
Integrated single-cell RNA-seq analysis of patients with endometriosis and without the disease identifies diverse cell populations. Single-cell RNA-seq was performed on single-cell suspensions generated from three ovarian endometriosis samples and three eutopic endometrium samples from the same patient and three normal endometria from patients without the disease. All nine samples were analysed using canonical correlation analysis within the Seurat R package (version 3.0). Cells were clustered using a graph-based shared nearest neighbour clustering approach and visualised using a t-distributed stochastic neighbour embedding (t-SNE) plot. A Workflow diagram showing the collection and processing of fresh samples from three endometriosis patients and three patients without the disease for scRNA-seq. B t-SNE plots of cells from the nine samples profiled in this study, with each cell colour coded to indicate the associated cell types. C Cells on the t-SNE plot of all nine samples were coloured as originating either from patients with endometriosis or from patients without endometriosis. D Expression phenotypes of markers in these clusters are shown in the heat map (each column represents an individual cluster; pink represents the minimum, black represents the median, and yellow represents the maximum expression values). These subpopulations were hierarchically clustered based on their marker expression patterns. E Canonical cell markers were used to label clusters by cell identity as represented in the t-SNE plot. Cell types were classified as fibroblasts (FBs), epithelial cells (Eps), endothelial cells (ECs), or immune cells as indicated in the legend

