Fig. 7.
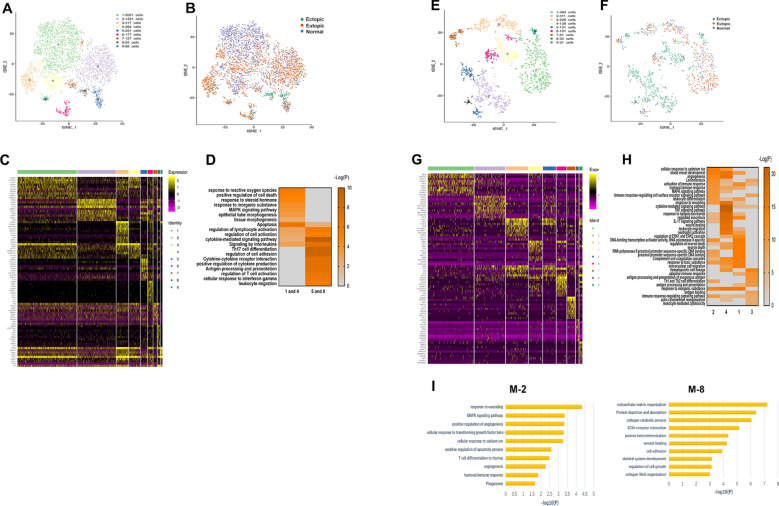
Distinct characteristics of NK and M subpopulations. A, B Nine subclusters were identified after NK cells were combined and clustered. C Heatmap showed the top ten positive marker genes within each cluster. All DEGs are found in Additional file 9. D GO and KEGG analysis were compared in characteristic subclusters of NK cells from three groups. E, F Nine subclusters were identified after M cells were combined and clustered. G Heatmap showed the top ten positive marker genes within each cluster. All DEGs are shown in Additional file 10. H GO and KEGG analysis were compared in characteristic subclusters of M cells from three groups. I Functional enrichment analysis with GO and KEGG analysis of M-2 and M-8

