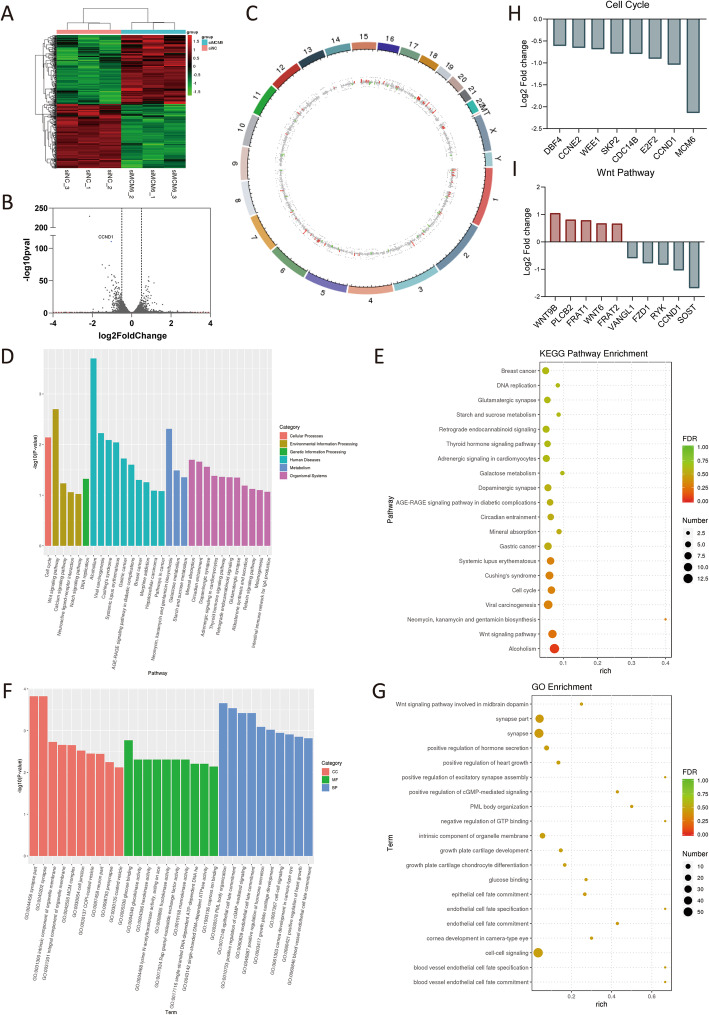
Fig. 5.
MCM6 activates pathways related to cell cycle regulation. (A) Cluster heat map of 6 samples. We used the R language Pheatmap software package to perform two-way clustering analysis on the union of different genes and samples of all comparison groups, clustering according to the expression level of the same gene in different samples and the expression pattern of different genes in the same sample, using the Euclidean method calculate the distance, the longest distance method of hierarchical clustering (complete Linkage) for clustering. In the figure, genes are represented horizontally, and each column is a sample. Red represents high expressed genes and green represents low expressed genes. (B) The volcanic map was drawn according to the gene distribution, gene expression fold change and significance results. On the left was the down-regulated gene of siMCM6 group relative to siNC group, and on the right was the up-regulated gene. The two vertical dotted lines were the threshold of 1.5 times fold change of gene expression difference, and the horizonal dotted line is the threshold of p value =0.05. (C) Genome circle diagram. We used the R language Circlize package to mark the differentially expressed RNA on the genome according to the genome information and the results of RNA differential expression analysis. The outermost circle is the chromosome band, from the outside to the inside are the differential expression analysis results of different differential analysis. Red and green are the histograms of the log2FoldChange values of the up-regulated and down-regulated genes, and the gray is the scatter plot of the log2FoldChange values of the undifferentially expressed genes. (D-E) The GO enrichment analysis results of differentially expressed genes. GO classification is carried out based on MF, BP and CC, and the top 10 GOs with the smallest p value, as well as the most significant enrichment in each GO classification term were selected to entry for display (D). The enrichment degree is measured by Rich factor, FDR value and the number of genes enriched to this GO Term. Among them, Rich factor refers to the ratio of the number of differential genes enriched in the GO Term to the number of annotated genes. The greater the Rich factor, the greater the degree of enrichment. FDR generally ranges from 0 to 1, the closer to 0, the more significant the enrichment. Select the top 20 GO Term entries with the smallest FDR value, that is, the most significant enrichment, for display (E). (F-G) The KEGG enrichment analysis results of differentially expressed genes. Select the top 20 pathways with the smallest p value for display (F). The degree of enrichment is measured by Rich factor, FDR value and the number of genes enriched on this pathway. As well as GO enrichment analysis, we selected the top 20 KEGG pathways with the smallest FDR value namely the most significant enrichment, for display (G). (H) Differentially expressed genes of the enriched cell cycle pathways and their differential expression levels. (I) Differentially expressed genes of the enriched Wnt pathways and their differential expression levels. GO, Gene Ontology; KEGG, Kyoto Encyclopedia of Genes and Genomes; FDR, p value correction; MF, molecular function; BP, biological process; CC, cell component

