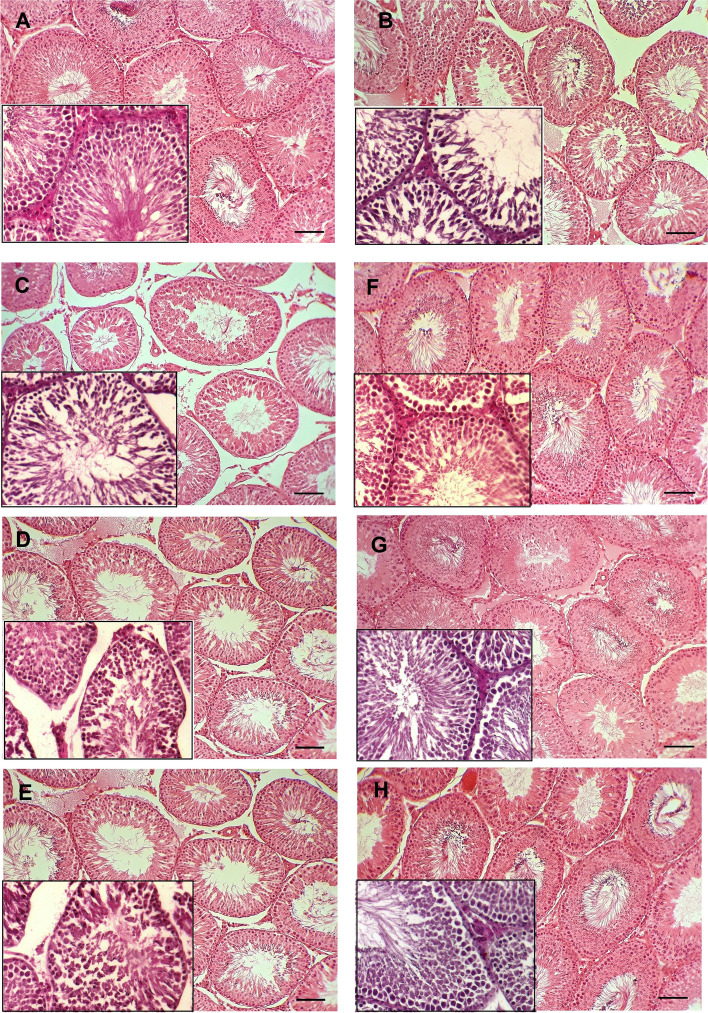
Fig. 3.
Morphological assessment of testicular tissue. A) Normal control group with typical seminiferous tubules showing the consecutive stages of spermatogenesis. B) Diabetic control group, C) HESS-100 group, D) HESS-200 group and E) HESS-400 group with tissue atrophy and degenerative changes in the seminiferous tubules including shrinkage, hypocellularity, vacuolation and rupture of the epithelium, and disrupted spermatogenesis. F) G (glibenclamide) group, G) G + HESS-200 group and H) G + HESS-400 group with mild histomorphological changes compared to the NC group

