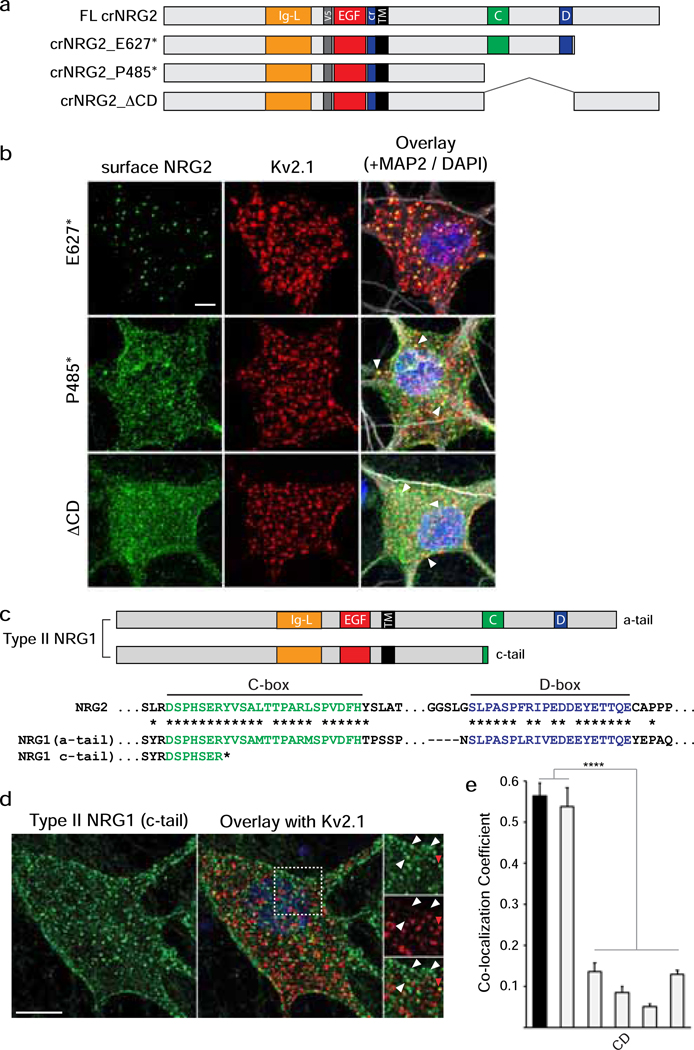
Fig. 3. NRG2 accumulates at ER-PM junctions via conserved sequence elements in its ICD.
(a) Schematic overview of NRG constructs used in this figure; motifs upstream of the TM are depicted as in Fig. 2a. Locations of conserved NRG2-ICD C/D-boxes are illustrated in green and blue, respectively. All deletions were introduced into crNRG2. (b) Representative Z-projected confocal images of neurons transduced with crNRG2_E627* (top), crNRG2_P485* (middle) or crNRG2_ΔCD (bottom). Cells were first surface-labeled with anti-V5 and subsequently labeled with anti-Kv2.1 and MAP-2 antibodies following permeabilization. Arrowheads in the crNRG2_E627* and crNRG2_P485* overlay images indicate puncta that overlap with Kv2.1 (see also Fig. S3). (c) Top, Schematic representation of a- and c-tail isoforms of type II NRG1. Note that c-tail NRG1 terminates upstream of the C-box. Bottom, Sequence comparison of the human NRG2 C- and D-boxes with the homologous sequences in the human NRG1 a-tail ICD. Conserved amino acids are marked by asterisks (*). The truncated c-tail is also shown. (d) Representative Z-projected confocal image of a transduced hippocampal neurons expressing type II NRG1 with the c-tail ICD and treated for 4 days with GM6001 (10 μM) and BACE-IV (1 μM) to block shedding. The image shows surface-labeled NRG1 using anti-V5 (left) and Kv2.1 labeled after permeabilization (right). The area marked by the bounding box in the overlay is magnified on the right and illustrates the lack of colocalization of most (white arrowheads) but not all (red arrowhead) NRG1 puncta with Kv2.1. Scale bar = 10 μM. (e) Quantitative analysis of colocalization of NRG2 variants and c-tail NRG1 with Kv2.1. Full-length crNRG2 (black) is included as reference. Data are plotted as weighted colocalization coefficients and represent the mean ± SEM (n=12 neurons per group). Note that the graph also includes data for the variant crNRG2_8A that is discussed in Fig. 5. ****, p<0.0001 (F (5,66) = 79.23; 1-way ANOVA with Tukey’s multiple comparison).

