
Figure 5.
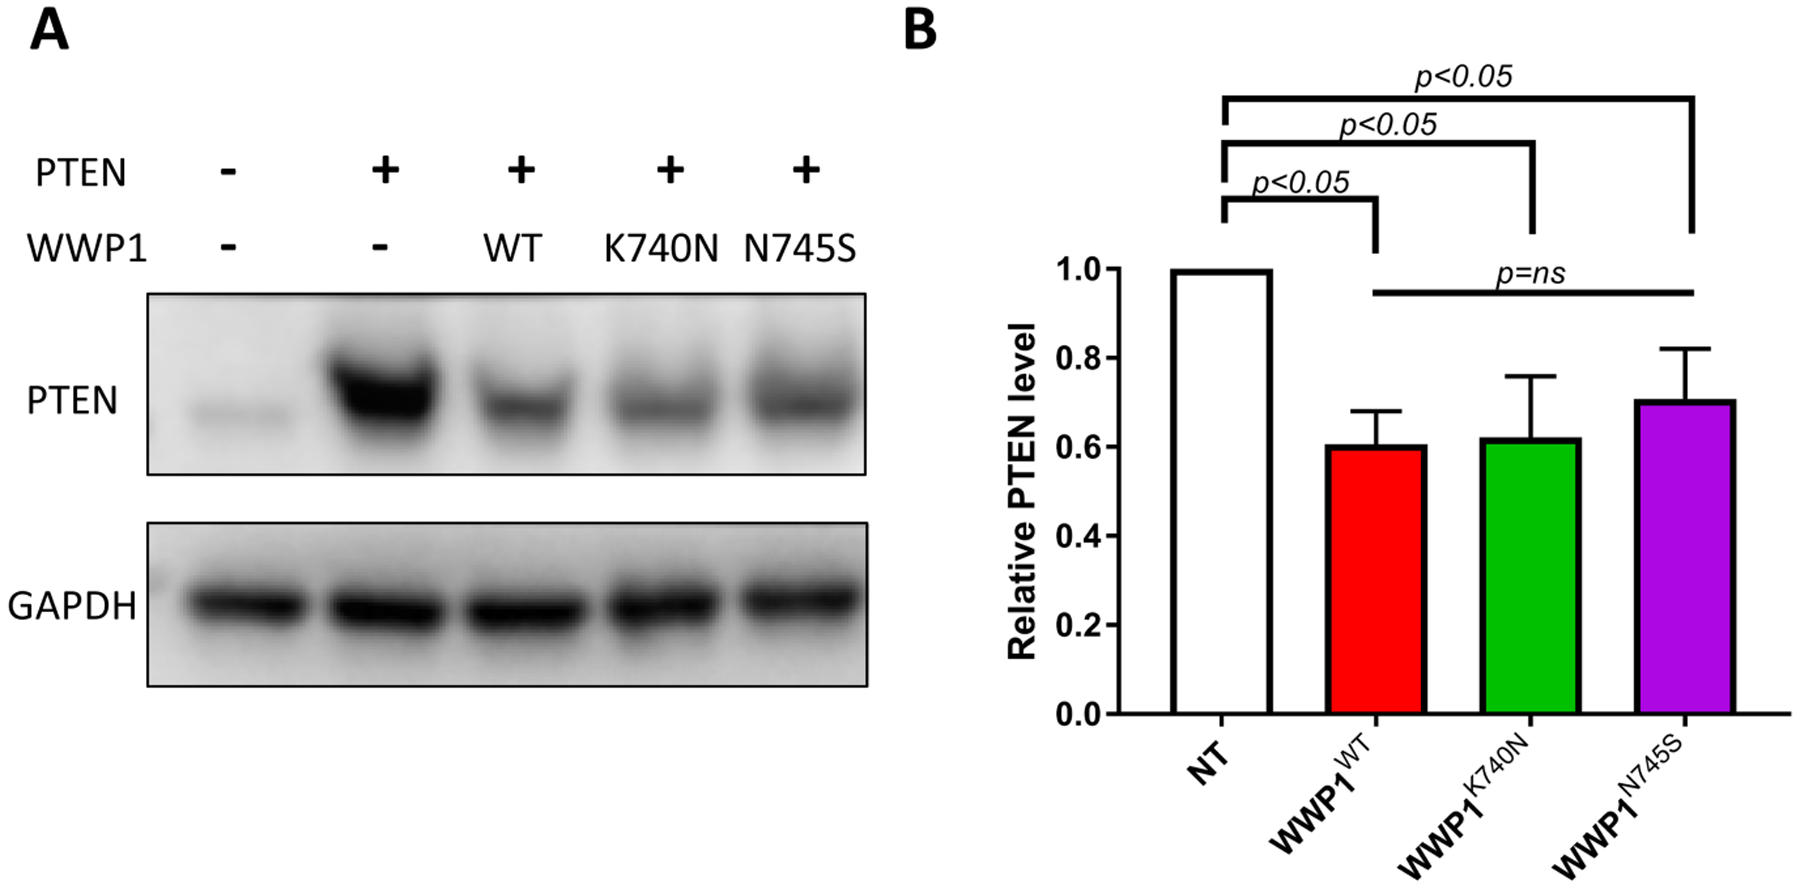
Analysis of the WWP1 mutants K740N and N745S on cellular PTEN level in cell transfection assays. (A) Western blot analysis of WWP1 wild type, K740N or N745S in HCT116 colon cancer cells. The HCT116 cells were transfected with plasmids expressing N-Myc-tagged full length WWP1: WT, K740N, and N745s, and co-transfected with PTEN (C124S) and wild type ubiquitin for 48 hr. Cells were lysed and analyzed by Western blot using anti-PTEN and anti-GAPDH antibody (n=4) (B) Quantification of PTEN expression level. PTEN and GAPDH bands were quantified by densitometric analysis using ImageJ software. The relative PTEN protein level was calculated by normalization with GAPDH as loading control (n=4, SEM shown as error bar). The statistical significance (p values) were detemined by Graphpad Prism and labeled as indicated in the graph (ns=non significant).