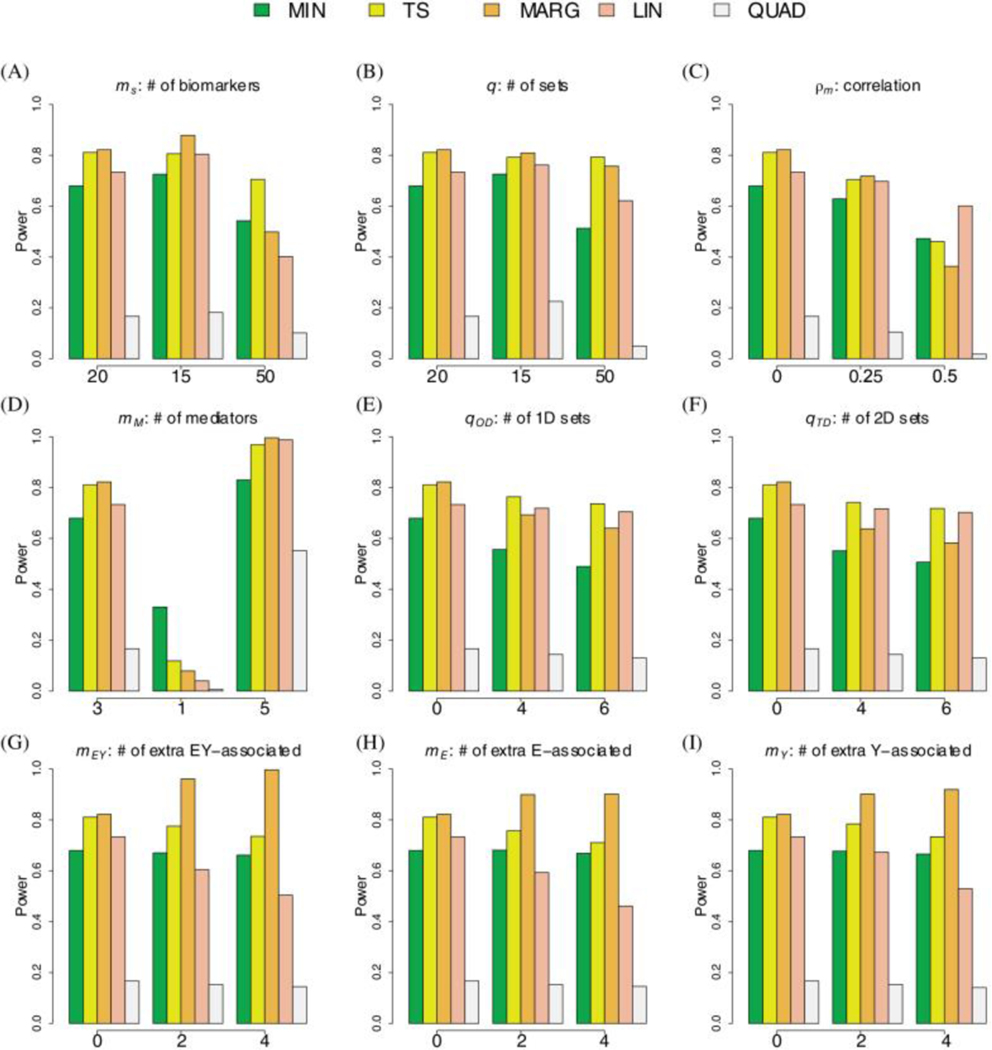
Figure 3: Simulations for Continuous Outcome.
The bar-plots show the power to detect the mediating set when using the TS (yellow), MIN (green), MARG (orange), LIN (red), and QUAD (brown) procedures. The baseline scenario includes 20 biomarkers per set, 20 disjoint sets, 1 mediating set, 0 one-dimensional sets, 0 two-dimensional sets, 3 mediating biomarkers, 0 noise-biomarkers, and a correlation of 0. We evaluate the effect of varying a single parameter, keeping all other parameters set to their baseline value.

