
Figure 4.
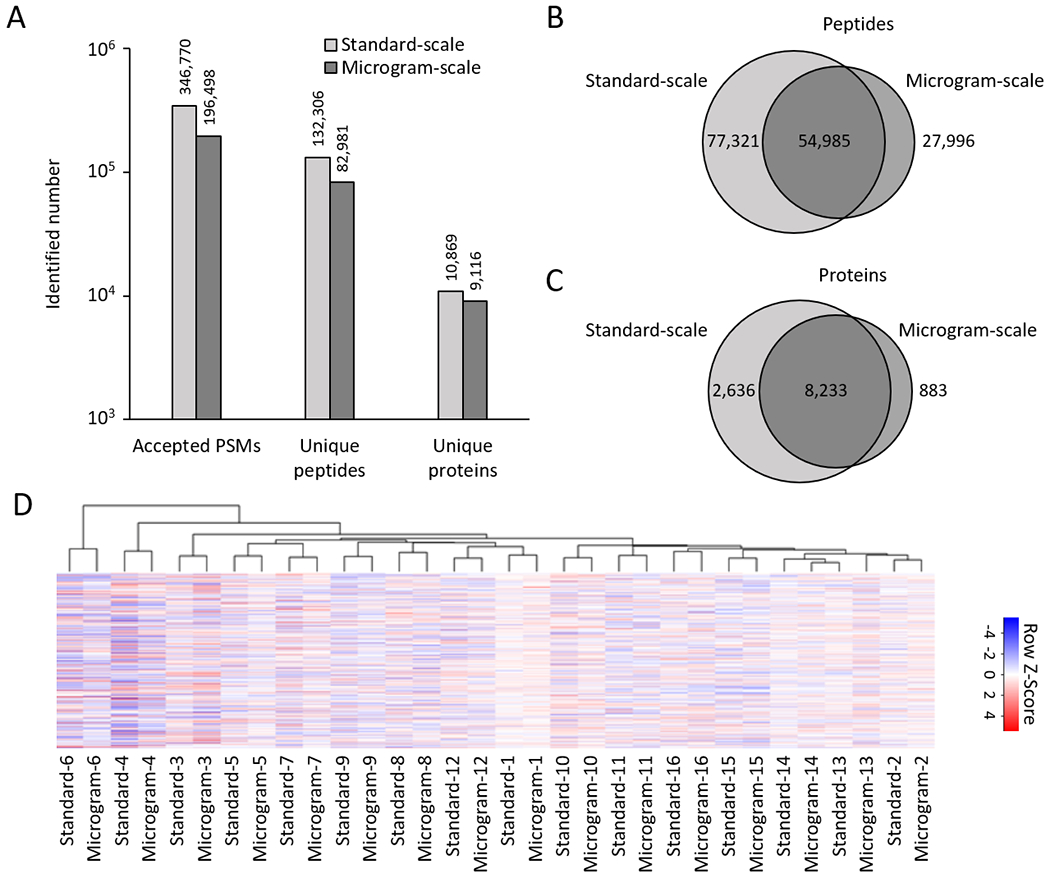
Microgram-scale protocol achieved comparable proteome profiling depth compared to the standard-scale method. (A) Comparison of accepted peptide-spectrum-match (PSM), peptide, and protein numbers. (B-C) Overlaps of identified proteins and peptides from the microgram- and standard-scale datasets. (D) Cluster heatmap of 32 samples analyzed by the microgram- and standard-scale methods using the top 20% most variable proteins.