
Figure 5.
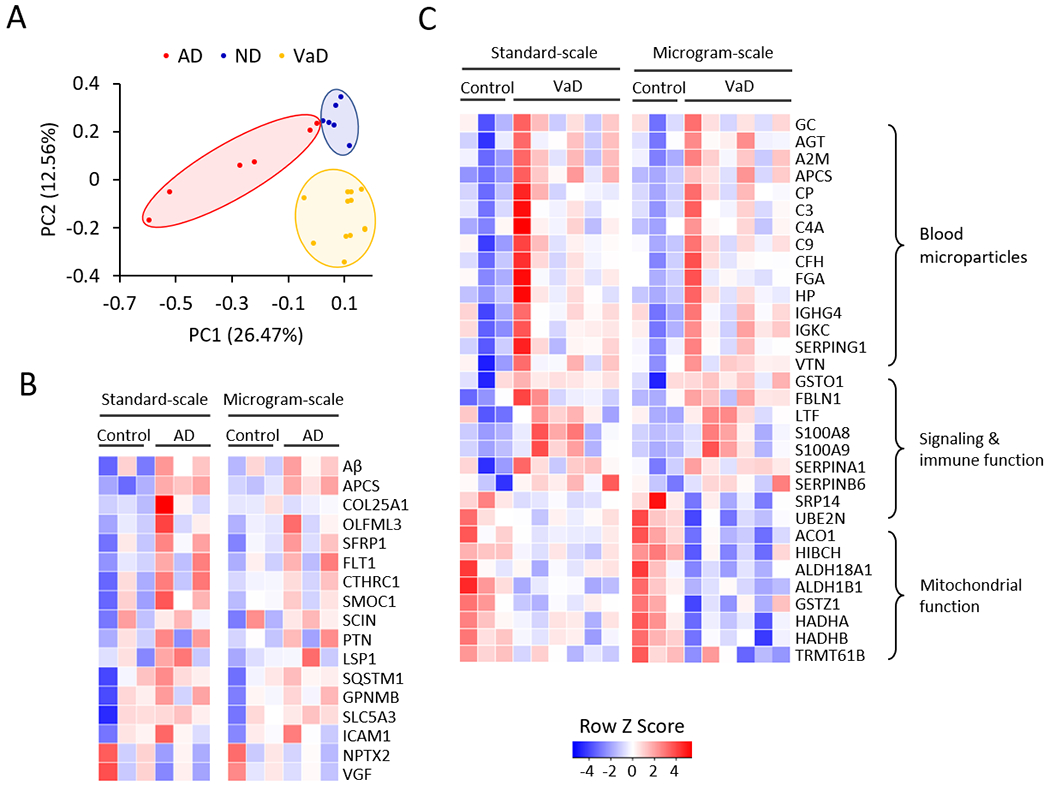
Bioinformatic analysis indicated the deregulated proteins in AD and VaD. (A) Principal component analysis (PCA) of identified proteins. Relative expression of all proteins was used as input of PCA, using an R statistical analysis package. (B) Heatmap of selected dysregulated AD proteins by standard- and microgram-scale TMT methods. (C) Heatmap of some DE proteins between the control and VaD samples, clustered in different pathways. Each protein was represented by a colored box after Z-score conversion.