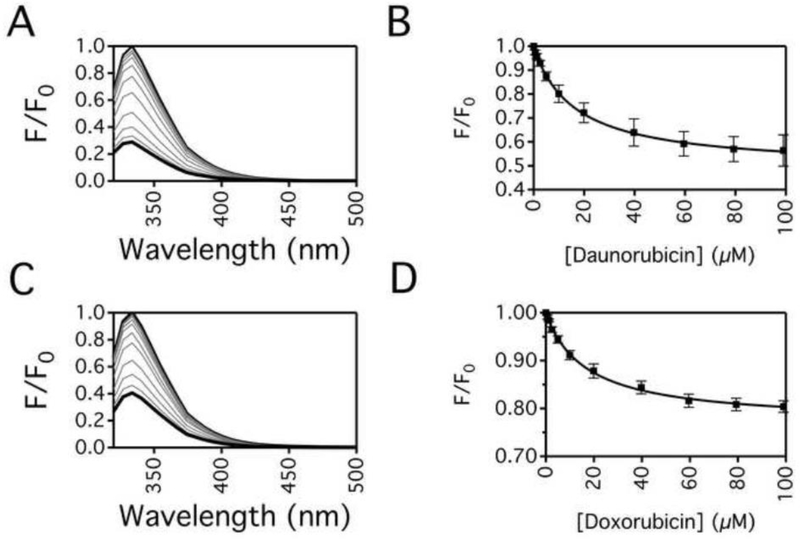
Fig. 3.
Protein fluorescence quenching of Pgp by DNR and DOX. Pgp fluorescence emission spectra after excitation at 295 nm in the presence of a range of (A) DNR and (C) DOX concentrations. Pgp fluorescence in the absence and the presence of saturating drug is shown as thin and thick black lines, respectively, while Pgp fluorescence with intermediate drug concentrations are shown as gray lines. The fluorescence at 330 nm after adjusting for inner filter effects with Eq. (2) with a range of (B) DNR and (D) DOX concentrations. The data points represent the average of at least three experiments with the error bars representing the standard deviation. Fits to the points by Eq. (3) are shown as solid lines.

