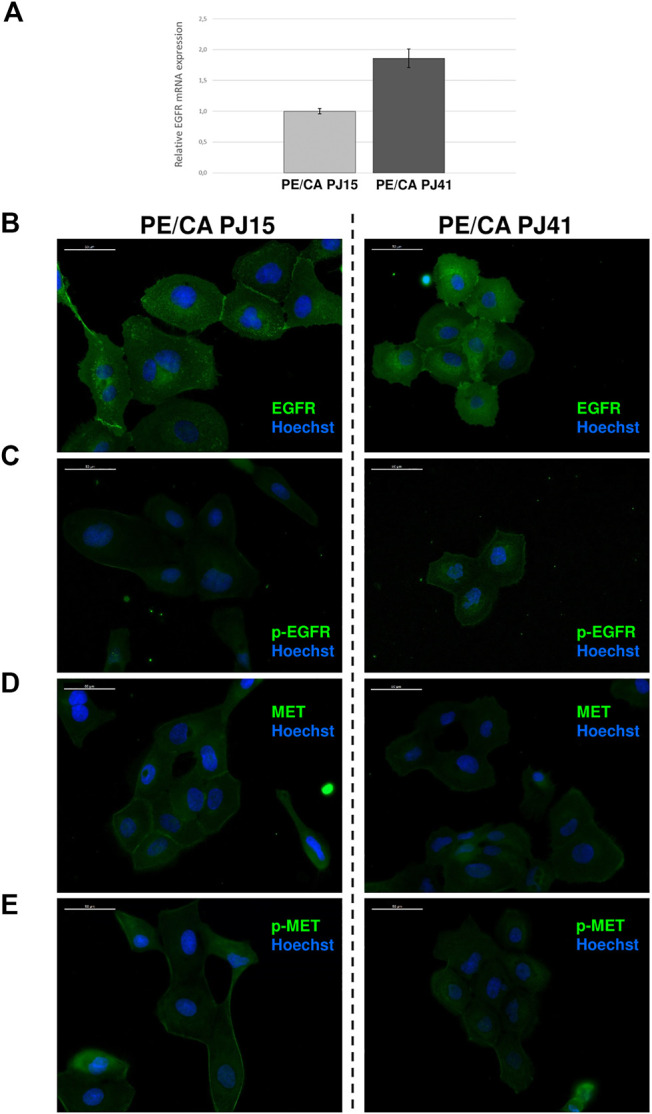
FIGURE 4.

Expression of EGFR and c-MET in HNSCC cell lines. EGFR mRNA expression measured by quantitative real-time PCR was nearly 2-fold higher in PE/CA-PJ41 cells compared to the PJ15 cell line (A). Immunocytochemistry of PJ15 (left) and PJ41 (right) showed that both HNSCC cell lines express the EGFR (B) and c-MET (D) proteins. Moreover, these receptors are active without exogenous ligand activation in these cells detected by phospho-specific antibodies recognizing the active receptors (C,E). However, while EGFR (in line with the flow cytometric data in Table 2) expression is higher in PJ41 cells (B), c-MET and p-c-MET expression was slightly higher in PJ15 cells (D,E). White bars mark 50 μm distance.
