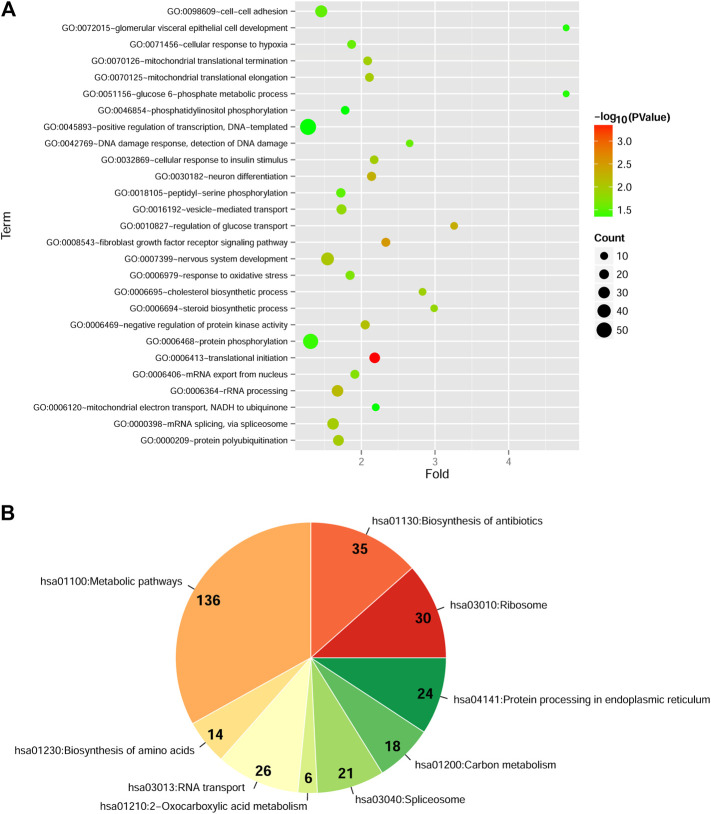
FIGURE 1.
Functional and pathway enrichment analyses of differentially expressed genes (DEGs) with consistent change patterns between GSE74629 and GSE15932 (A): The significantly enriched Gene Ontology-biological process (GO-BP) terms. Vertical axis shows enrichment fold values and horizontal axis shows the names of GO-BP terms. Node size denotes the number of genes, and the bigger node the larger number of genes. Node color indicates the enrichment significance, the closer to the red the higher significance (B): The significantly enriched Kyoto Encyclopedia of Genes and Genomes (KEGG) pathways. The parts in pie chart represent the specific KEGG pathways. The Arabic numerals show the number of DEGs involved in each KEGG pathway. The color indicates the enrichment significance, the closer to the red the higher significance.

